The cryptocurrency market experienced one of its most severe downturns this bear market, with major digital assets suffering double-digit percentage losses. This widespread sell-off, which saw most cryptocurrencies fall by over 10%, has left investors bracing for further volatility as key support levels are tested and, in some cases, broken. This in-depth analysis examines the performance of Ethereum (ETH), Ripple (XRP), Cardano (ADA), Binance Coin (BNB), and Hyperliquid (HYPE), highlighting their recent price action, key technical indicators, and potential future trajectories.
Ethereum (ETH): Navigating the $1,800 Resistance and the $1,500 Support
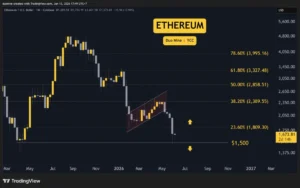
Ethereum, the second-largest cryptocurrency by market capitalization, was not spared from the market’s bearish sentiment. The digital asset saw a significant decline of approximately 17% over the past week. A critical psychological and technical support level at $1,800 failed to hold, quickly transforming into resistance as selling pressure intensified.
At the time of reporting, Ether’s price is trading below the $1,700 mark, indicating a struggle to attract substantial buying interest. Analysts are closely watching the $1,500 level, which previously acted as a significant reversal point in early 2025, as the next potential area of support. The history of this level suggests it could provide a temporary reprieve for buyers, but the prevailing bearish trend poses a considerable threat.
The current market conditions suggest that the bear market is in full swing, with no immediate signs of abatement. This outlook implies that further downside potential for Ethereum is a realistic scenario, with some analysts forecasting a retest of the $1,000 price region if the broader market downturn continues unabated. The prolonged bear market cycle, characterized by lower lows and diminished investor confidence, necessitates a mentally prepared approach for those invested in ETH.

The technical chart for Ethereum displays a clear downtrend, with the price action decisively breaking below the $1,800 support. This break is a bearish signal, suggesting that sellers are in control and are likely to push the price lower. The failure to establish higher highs and higher lows is indicative of a weakening market sentiment. The convergence of moving averages and the sustained bearish momentum on indicators like the Relative Strength Index (RSI) further support the notion of continued downward pressure.
Ripple (XRP): Testing the $1 Support Amidst Dominant Short Sellers
Ripple’s native cryptocurrency, XRP, also experienced a significant downturn, plummeting by approximately 14% and establishing a new lower low. This sharp decline followed a breach of a perceived "blue pennant" formation on its price chart, which is often interpreted as an early bearish signal. The pattern suggested a potential continuation of the downward trend, which has now materialized.
The market dynamics for XRP are currently characterized by the dominance of short sellers, who appear intent on testing the crucial $1 support level. This level holds significant psychological importance and has historically acted as a bedrock for XRP. While this psychological barrier might attract some buyers seeking an entry point, the overall bearish sentiment in the broader crypto market could undermine its effectiveness in halting the downtrend.
The formation of a lower low in XRP’s price action is a strong indicator that the existing downtrend remains intact and shows no immediate signs of reversal. Investors and traders are advised to closely monitor the price reaction at the $1 mark. Should this level fail to hold and subsequently act as resistance, the next significant support level to watch would be $0.80.
The technical analysis of XRP reveals a pattern of declining peaks and troughs. The breakdown from the pennant pattern suggests a continuation of the prevailing bearish momentum. The volume accompanying the price decline indicates strong selling pressure. Further indicators such as the MACD (Moving Average Convergence Divergence) showing bearish crossovers and the RSI entering oversold territory, but failing to rebound, all point towards potential further downside. The current sentiment, driven by speculative short-selling, could exacerbate price declines if market makers or large holders decide to liquidate their positions.
Cardano (ADA): The Crackdown of $0.24 and the Grind Towards $0.15
Cardano (ADA) faced a particularly brutal week, experiencing a staggering 30% price crash. This significant decline occurred after the long-standing support level at $0.24 finally gave way. The breach of this crucial support triggered a rush of sellers, driving the price sharply downwards. This marks ADA’s worst performance since the notable crash experienced on October 10th, 2025.
With $0.24 now established as resistance, Cardano’s prospects for an immediate recovery appear slim. The more probable scenario, according to market analysts, is a gradual downward trend as sellers continue to exert pressure, aiming to find a definitive bottom. The current support level is identified at $0.15, but its ability to withstand the persistent sell-off remains questionable if the bearish sentiment continues unabated.
Looking ahead, the technical charts for Cardano offer little in the way of bullish signals. Market sentiment surrounding ADA is reportedly at an all-time low for 2026, suggesting that a significant turnaround would require a substantial and unforeseen catalyst. The $0.15 support level will be critical in providing some measure of relief from the recent dramatic price action.
The chart patterns for ADA illustrate a clear breakdown from a prolonged consolidation phase. The failure to hold the $0.24 support, which had been a key level for months, has opened up the possibility of further declines. The volume profile analysis indicates significant selling activity around the breach of $0.24. Indicators such as the Average Directional Index (ADX) suggesting a strong downtrend, coupled with bearish divergences on longer-term moving averages, paint a grim picture for ADA in the short to medium term. The lack of positive fundamental news or development updates has also contributed to the negative sentiment.
Binance Coin (BNB): A "Bait and Switch" Scenario at $690
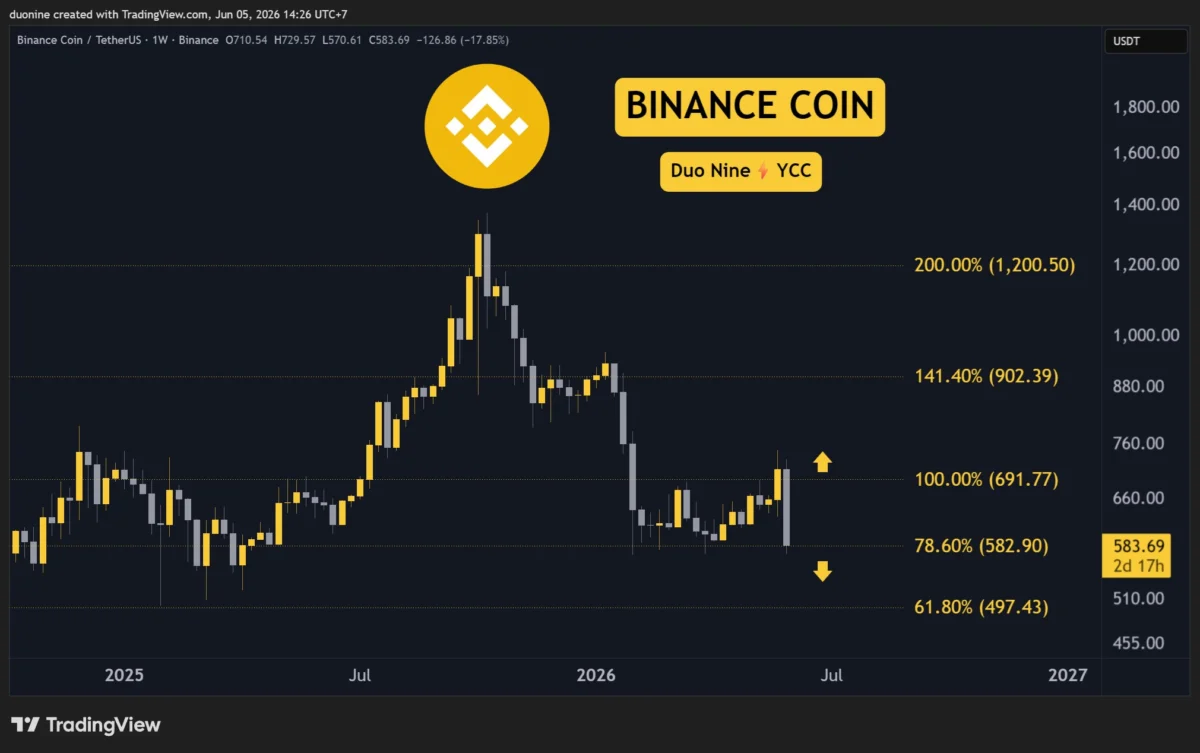
Binance Coin (BNB) exhibited a classic "bait and switch" price action pattern over the past week. The cryptocurrency initially broke through the resistance level at $690, leading some investors to believe in a bullish continuation. However, this breakout proved to be short-lived, as the price quickly reversed and plunged by over 20%, returning to the support level at $580. This sharp reversal trapped many traders who had entered positions based on the apparent breakout.
Despite the initial surge, BNB ultimately closed the week down by 7%. This price action is viewed as a bearish signal, indicative of underlying weakness and a lack of conviction among potential buyers. The failure to sustain the upward momentum after breaking a key resistance level suggests that the bulls are struggling to maintain control.
Looking forward, there is a significant likelihood that BNB could fall below the $580 support level. If this occurs, the next logical target for the bears would be the $500 mark. This projection is influenced by the broader market sentiment, which could drag BNB lower even if bulls have managed to defend the $580 level since early 2026. The resilience of this support has been tested multiple times, and its eventual failure could lead to a more significant price correction.
The technical chart for BNB reveals a deceptive pattern. The brief surge above $690 created a false breakout, followed by a sharp decline and a retest of a prior support level. The volume analysis shows a spike during the initial breakout and subsequent sharp decline, indicating significant volatility and potential manipulation. The RSI is showing bearish divergence, and the MACD has recently crossed bearishly. The sustained defense of $580 has been notable, but the overall market conditions suggest this could be a temporary consolidation before a further move downwards.
Hyperliquid (HYPE): Retracing Gains and Consolidating Near $60
Hyperliquid (HYPE) has seen its price retrace to levels seen a week prior, effectively erasing recent gains after establishing a new all-time high of nearly $76. This pullback provides an opportunity for HYPE to retest the breakout level at $60. The critical question for investors is whether this $60 level will hold firm as support.
Should the $60 support fail to materialize, a further decline towards the $50 region is anticipated, where a more significant and established support level is located. As long as this $50 support remains intact, the uptrend that began in January 2026 is likely to continue. However, the recent sharp retracement suggests a need for caution.
From a forward-looking perspective, HYPE has already experienced a remarkable year. A healthy correction and period of consolidation appear overdue. Such a pullback would be beneficial for the cryptocurrency, as any further ascent at this juncture without proper consolidation could lead to a more aggressive and potentially damaging correction down the line. This suggests that a period of sideways movement or a modest decline might be the most constructive outcome for HYPE’s long-term health.
The technical chart for HYPE illustrates a classic parabolic move followed by a sharp reversal. The establishment of an all-time high near $76, followed by a rapid decline, indicates profit-taking and a shift in market sentiment. The retest of the $60 breakout level is a crucial juncture. If this level is breached, the $50 support becomes the next key area of interest. The volume accompanying the price drop is significant, underscoring the intensity of the recent sell-off. The RSI has moved from overbought territory back towards neutral, and the MACD is showing signs of weakening momentum.
Broader Market Implications and Investor Sentiment
The synchronized downturn across these prominent cryptocurrencies underscores a broader market sentiment characterized by fear and uncertainty. Factors contributing to this bearish environment include macroeconomic headwinds, such as rising inflation and interest rate hikes in traditional markets, which often lead investors to de-risk from more speculative assets. Regulatory scrutiny within the crypto space also continues to cast a shadow, creating apprehension among institutional and retail investors alike.
The cyclical nature of the cryptocurrency market, marked by periods of rapid growth followed by significant corrections, appears to be in a pronounced bearish phase. The failure of major support levels to hold suggests that the market is still searching for a stable bottom. This environment necessitates a cautious approach, with investors advised to conduct thorough due diligence, manage risk effectively, and avoid impulsive decisions driven by short-term price fluctuations.
The prolonged bear market cycle, while challenging for current holders, often presents opportunities for long-term investors to accumulate assets at potentially lower valuations. However, predicting the exact timing and depth of market bottoms remains a significant challenge in the volatile cryptocurrency landscape. The coming weeks and months will be crucial in determining whether the current downtrend will accelerate or if signs of stabilization and eventual recovery will emerge. The performance of these leading cryptocurrencies will serve as a barometer for the overall health and direction of the digital asset market.