The cryptocurrency market, characterized by its inherent volatility and rapid fluctuations, often presents intriguing patterns for investors and analysts alike. Within this dynamic landscape, the PI Network (PI) has recently entered a period of consolidation, trading within a well-defined horizontal channel. This price action raises a critical question for market participants: can PI break free from this range and establish a new upward trajectory?
PI Network Caught in a Price Channel: A Technical Overview
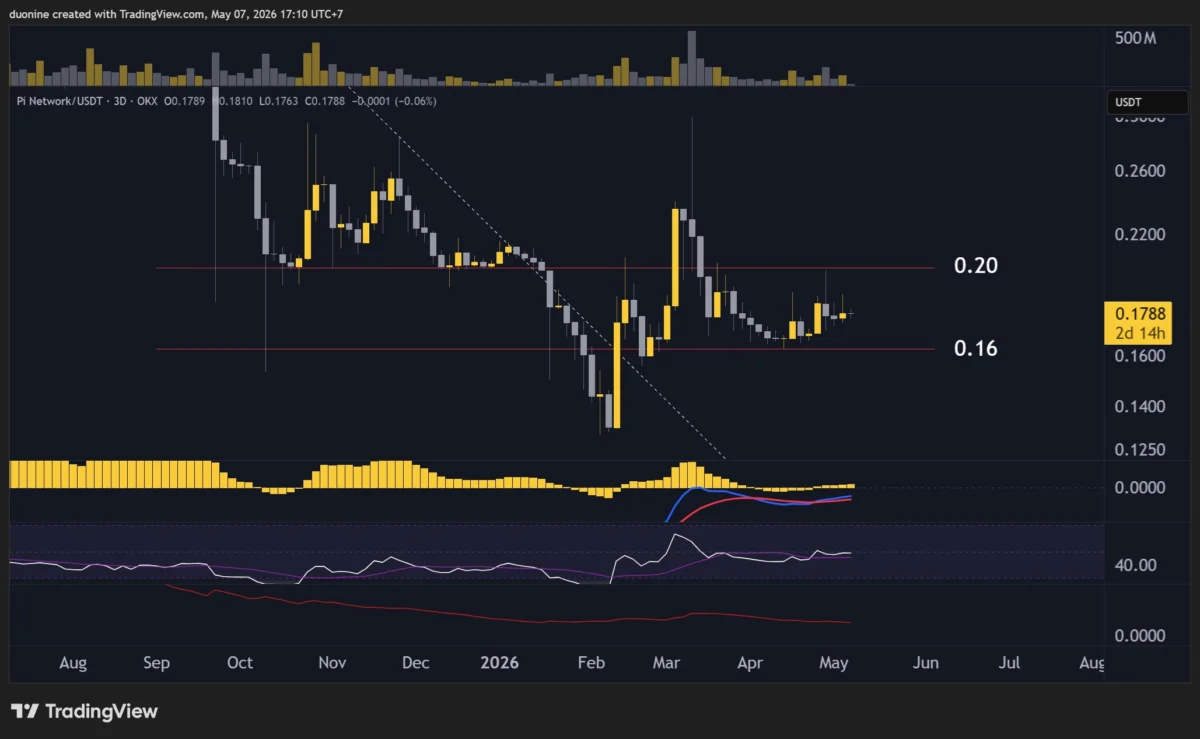
Since hitting a low of approximately 13 cents, the price of PI has found itself confined to a trading range between $0.16 and $0.20. This sideways movement has persisted since early March, with numerous attempts to breach these boundaries being met with significant selling pressure. The resilience of this channel suggests a delicate balance between buying and selling forces, where neither bulls nor bears have managed to gain decisive control.
A notable instance of this struggle occurred in late April, when buyers attempted to push PI above the crucial $0.20 resistance level. This surge in buying interest was met with a swift and decisive reaction from sellers, evidenced by two significant spikes in selling volume. These sell-offs effectively quelled the bullish momentum, forcing the price back towards the lower boundary of the channel, the key support level at $0.16. This pattern of rejection at resistance and retreat to support has become a recurring theme, underscoring the current stalemate in the PI market.
Key Support and Resistance Levels to Watch
For traders and investors monitoring PI’s price action, identifying key support and resistance levels is paramount. Currently, the primary support level stands at $0.16. A decisive break below this mark could signal a further downward movement, potentially towards previous lows. Conversely, the immediate resistance lies at $0.20, a level that has repeatedly thwarted bullish advances. Beyond this, a more significant resistance level is observed at $0.28, which could become a target for PI should it manage a sustained breakout above its current trading range.

Momentum Indicators Suggesting Stagnation
The lack of clear directional momentum in PI’s price is further corroborated by the behavior of its technical indicators. Since March, these indicators have largely mirrored the sideways price action, oscillating around their mid-range values. This suggests a market that is neither strongly bullish nor bearish, but rather in a state of equilibrium.
Despite periods of increased trading volume, particularly in late April and May, these surges have not been substantial enough to overcome the entrenched selling pressure at the $0.20 resistance. This indicates that while there may be intermittent interest from buyers, it has not yet translated into sustained buying power capable of breaking the established pattern. However, the possibility of another attempt to challenge the $0.20 resistance remains, and if successful, the next logical target for optimistic investors would be the $0.28 mark.
The Role of the Relative Strength Index (RSI)
The daily Relative Strength Index (RSI), a popular momentum oscillator used to measure the speed and change of price movements, has also been trading around the 50-point mark in the past week. The RSI hovering around its midpoint is a classic indicator of indecision in the market, reflecting a lack of strong buying or selling conviction. This neutral stance of the RSI aligns perfectly with PI’s price being range-bound, currently trading around $0.18, the approximate midpoint of its established channel.
For a bullish bias to emerge and for the price to potentially break out of its current confines, the daily RSI would ideally need to ascend above the 50-point level and approach the overbought territory, typically around 70. Such a move would signal a renewed influx of buying pressure and growing confidence among investors. This upward trend in the RSI could coincide with a renewed assault on the $0.20 resistance, potentially leading to a significant price movement.
Historical Context and Potential Catalysts for a Breakout
The current price consolidation for PI Network is not an isolated event in the cryptocurrency market. Many digital assets experience periods of accumulation or distribution before making significant price moves. The prolonged sideways trading can often be interpreted as a period of market digestion, where previous gains are consolidated, and new buying interest is built at lower levels.
The PI Network project itself has garnered significant attention due to its unique approach to cryptocurrency mining through a mobile application. Launched in late 2019, PI aimed to make cryptocurrency accessible to a broader audience, allowing users to "mine" PI coins using their smartphones without substantial energy consumption. This innovative model has contributed to a large and engaged user base. However, the token’s official listing on major cryptocurrency exchanges and its subsequent price discovery have been subjects of considerable anticipation and speculation within the community. The current price action, while seemingly stagnant, could be interpreted as a prelude to a more significant development, such as a wider exchange listing or the implementation of key features within the PI ecosystem.
Analyzing the Implications of a Breakout
A decisive break above the $0.20 resistance level would be a significant technical event for PI. It would signal a potential shift in market sentiment and could attract further buying interest, potentially leading to a cascade effect as traders react to the bullish signal. The immediate target, as previously mentioned, would be the $0.28 resistance. A successful breach of this level could then pave the way for further upward momentum, potentially testing higher price points.
Conversely, a breakdown below the $0.16 support level could trigger a wave of selling, as stop-loss orders are likely to be triggered. This could lead to a rapid price decline, potentially revisiting the 13-cent lows or even establishing new ones. The volume accompanying any breakout or breakdown will be a critical factor in confirming the validity of the move. High volume on a breakout would lend more credibility to the bullish sentiment, while high volume on a breakdown would confirm the bearish pressure.
Broader Market Conditions and PI’s Position
The performance of PI Network is also influenced by the broader cryptocurrency market trends. During periods of general market bullishness, even range-bound assets tend to experience upward pressure. Conversely, a bearish crypto market can drag down even assets that are otherwise showing signs of stability. As of the latest analysis, the cryptocurrency market has been exhibiting signs of recovery after a period of correction. This general positive sentiment could provide a favorable backdrop for PI to attempt a breakout from its current channel.
However, it is crucial to remember that the PI Network is still a relatively nascent project compared to established cryptocurrencies like Bitcoin or Ethereum. Its price action can be more susceptible to project-specific developments and community sentiment. Any official announcements regarding mainnet launch, exchange listings, or significant technological advancements could act as powerful catalysts for price movement.
Community Sentiment and Future Outlook
The PI community remains highly engaged and optimistic about the future of the project. Discussions on social media platforms and dedicated forums often revolve around potential price targets and the timeline for wider adoption and exchange listings. This strong community backing can play a significant role in driving demand and supporting the price, especially during periods of consolidation.
While technical analysis provides valuable insights into potential price movements, fundamental factors and community sentiment are equally important for long-term growth. The sustained development of the PI ecosystem, coupled with increasing utility and adoption, will ultimately determine its long-term success and impact on its market price.
In conclusion, the PI Network (PI) is currently navigating a critical juncture, trading within a defined horizontal channel. The price has been capped by resistance at $0.20 and supported at $0.16, reflecting a period of market indecision. Momentum indicators, including the RSI, suggest a lack of clear direction, hovering around their midpoints. The coming weeks will be crucial in determining whether PI can muster the necessary buying pressure to break free from this consolidation and ascend towards higher price targets, or if it will succumb to selling pressure and retest lower support levels. Investors and observers will be closely watching for any signs of a sustained breakout, which could be triggered by renewed market enthusiasm, positive project developments, or a shift in broader cryptocurrency market trends. The outcome of this battle between buyers and sellers at the $0.20 resistance will likely shape PI’s trajectory in the near to medium term.
Disclaimer: The information provided in this article is for informational purposes only and does not constitute financial advice. Investing in cryptocurrencies involves significant risk, and individuals should conduct their own thorough research and consult with a qualified financial advisor before making any investment decisions. The author and publisher of this article are not responsible for any losses incurred as a result of using this information.