PI Network (PI) has recently demonstrated a notable recovery, reclaiming the $0.13 mark as buying interest returns to the market. This resurgence follows a period of decline, prompting speculation about the cryptocurrency’s potential upward trajectory. Technical indicators suggest a potential shift in momentum, though caution is advised due to lingering low trading volumes.
PI Finds a Local Bottom Amidst Bullish Divergence
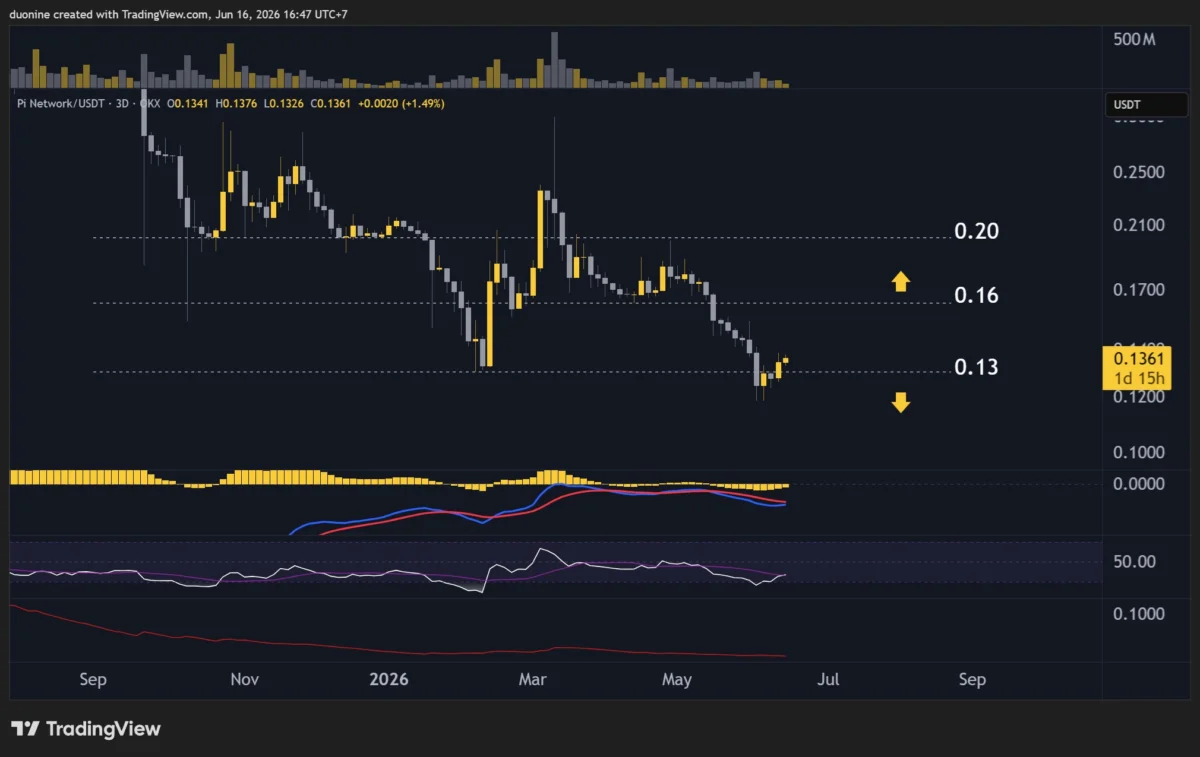
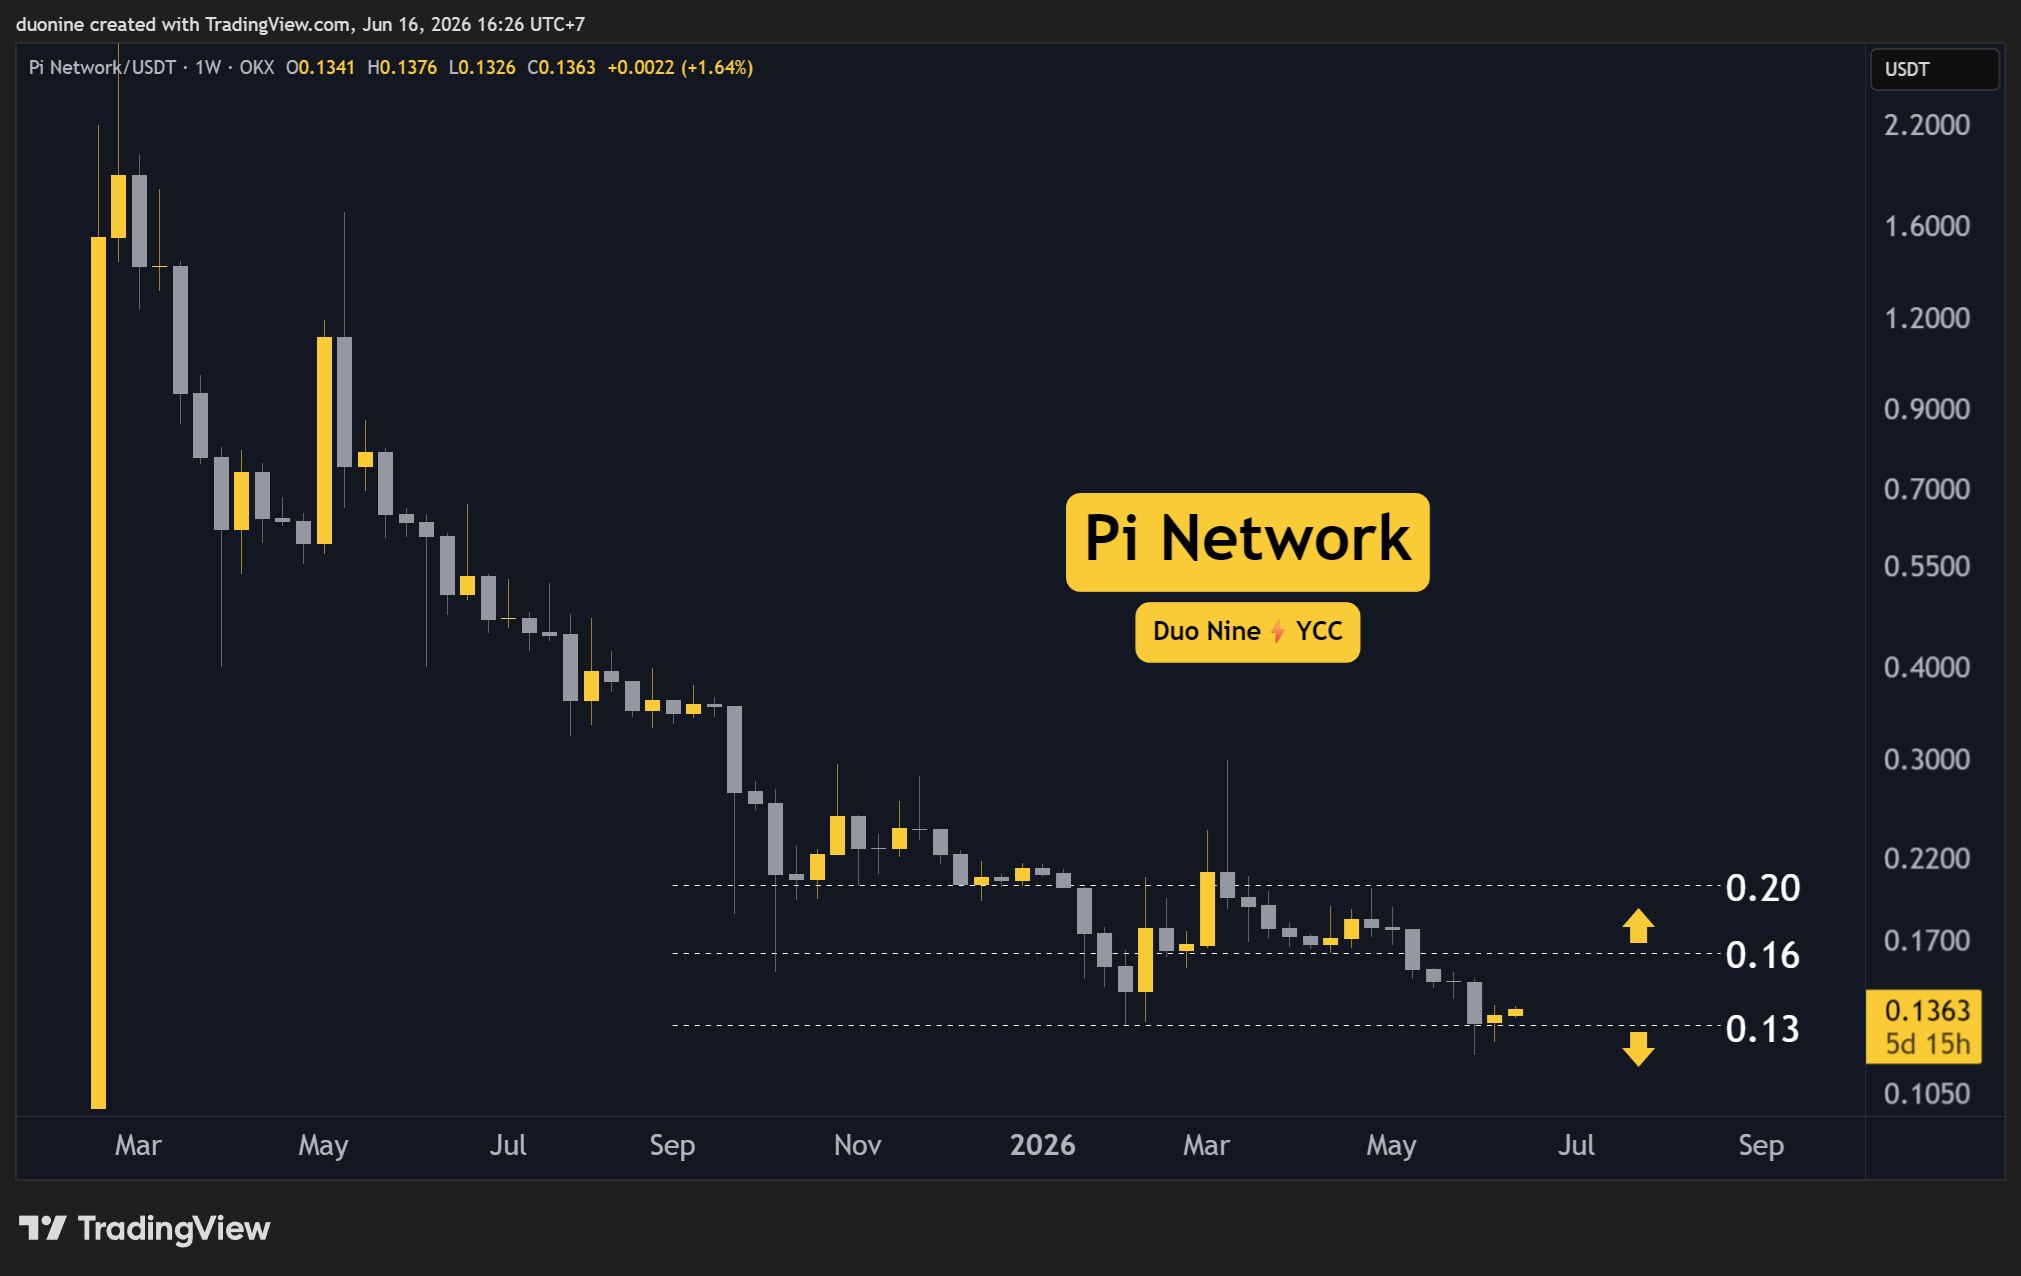
At the time of reporting, PI’s price action indicates that it may have established a local bottom around the $0.13 level. This price point is now acting as a crucial support, and sustained trading above it could signal a bullish outlook for the cryptocurrency. The observed price behavior, where PI made a lower low on the chart, is contrasted by a higher low on the Relative Strength Index (RSI). This discrepancy, known as bullish divergence, is a classic technical signal suggesting that the downward momentum may be waning and a potential trend reversal could be on the horizon. For this bullish sentiment to gain stronger conviction, PI will need to decisively break through key resistance levels, initially at $0.16, and subsequently at the more significant $0.20 mark.
The concept of bullish divergence arises from the idea that while the price is falling, underlying buying pressure is gradually increasing. The RSI, a momentum oscillator, measures the speed and change of price movements. When the price makes a new low but the RSI fails to do so, it implies that sellers are losing their grip and buyers are starting to re-enter the market with less selling pressure than before. This can be a leading indicator of a potential reversal.
Navigating Key Support and Resistance Levels
The immediate focus for PI’s price trajectory lies in its ability to hold above the $0.13 support level. This psychological and technical barrier has proven significant in recent trading sessions. A sustained hold above $0.13 would provide a foundation for further upward movement.
Conversely, the resistance levels present immediate hurdles. The $0.16 mark is the first significant barrier that buyers will need to overcome. A successful breach of this level could pave the way for a test of the $0.20 resistance. Breaking through $0.20 would represent a more substantial bullish breakout, potentially signaling the end of the recent downtrend and opening doors for further price appreciation.
The interplay between support and resistance levels is fundamental to technical analysis. Support levels are price points where buying pressure is expected to be strong enough to overcome selling pressure, preventing further price declines. Resistance levels are price points where selling pressure is anticipated to be strong enough to counteract buying pressure, halting upward price movements.
The Cautionary Tale of Low Trading Volume
Despite the positive signals from bullish divergence and the reclaiming of key support, a critical concern remains: the persistently low trading volume. While PI’s price has been gradually appreciating, this upward movement is not being accompanied by a substantial increase in buying activity. This scenario suggests that the current buying pressure might be fragile, and any significant selling pressure could easily negate the recent gains.
Low volume during an uptrend can be interpreted as a sign of a lack of conviction from buyers. It suggests that the market is not yet fully convinced of a sustainable recovery. If sellers decide to exert more pressure, the limited buying interest could be overwhelmed, leading to a rapid reversal. This situation is often referred to as a "bull trap," where traders might enter long positions based on the apparent upward momentum, only to find themselves caught as the price reverses sharply downwards.
For the current recovery to be considered robust and sustainable, an increase in trading volume, particularly buy volume, is essential. This would indicate that more participants are entering the market and are willing to accumulate PI at current prices, providing the necessary fuel for a sustained rally. The absence of this confirmation leaves the market vulnerable to renewed selling pressure.
The volume profile of a cryptocurrency is a crucial indicator of market sentiment and conviction. High volume during a price increase typically validates the strength of the trend, while low volume during such a move raises questions about its sustainability. Traders often look for volume confirmation to validate price movements, especially during potential trend reversals.
Daily MACD Signals a Bullish Bias
Adding to the optimistic outlook, momentum indicators such as the daily Moving Average Convergence Divergence (MACD) have turned bullish. This bullish sentiment has been observed since PI’s price successfully reclaimed and sustained itself above the $0.13 support level. The MACD, which comprises the MACD line, the signal line, and the histogram, is a widely used tool to identify trend changes and momentum. A bullish crossover, where the MACD line moves above the signal line, typically indicates an increase in upward momentum.
The current bullish reading on the MACD suggests that the price is likely to continue its ascent, at least towards the $0.16 resistance level. This level is considered the first major hurdle in PI’s path towards further recovery.
The implications of a bullish MACD signal are significant. It suggests that the recent price action is not merely a temporary bounce but is supported by underlying momentum shifts. However, the ultimate success of this upward movement hinges on the ability of buyers to muster enough strength and volume to break through the identified resistance levels.
Potential Scenarios and Future Outlook
The immediate future for PI’s price hinges on its ability to consolidate its gains above $0.13 and then challenge the $0.16 resistance.
-
Bullish Scenario: If PI manages to break above $0.16 with increased volume, it could pave the way for a test of the $0.20 resistance. A decisive break above $0.20 would strengthen the bullish case considerably, potentially leading to further upward price discovery. This scenario would be supported by sustained buying pressure and positive market sentiment.
-
Bearish Scenario: Conversely, a rejection at the $0.16 resistance level could signal a return of sellers. Such a rejection might encourage bearish traders to re-enter the market, potentially driving PI’s price back down to the $0.13 support level. If this support fails, further declines could ensue, invalidating the recent recovery. This scenario would be exacerbated by a lack of buying volume and a resurgence of selling pressure.
The cryptocurrency market is inherently volatile, and PI Network is no exception. While technical indicators provide valuable insights, external factors such as market sentiment, broader economic conditions, and any developments within the PI Network ecosystem itself can significantly influence its price.
Background and Context of PI Network
PI Network is a digital currency project that aims to make cryptocurrency mining accessible to everyday people through mobile phones. Launched in 2019, it operates on a model where users can "mine" PI coins by performing daily check-ins on a mobile app, without requiring significant computational power or energy consumption like traditional cryptocurrencies such as Bitcoin. The project’s long-term vision includes building a decentralized ecosystem where PI can be used for transactions, services, and various applications.
However, PI Network has faced scrutiny and skepticism due to its prolonged closed-beta phase and the absence of a public mainnet launch and listing on major cryptocurrency exchanges for a significant period. This has led to questions about its legitimacy and the actual value of the mined PI coins. The price fluctuations observed, often quoted on over-the-counter (OTC) markets or within unofficial trading groups, do not reflect official exchange listings. The recent price action around $0.13 suggests a re-emergence of trading interest, possibly fueled by anticipation of future developments or increased accessibility to the token.
Implications for Investors and the Ecosystem
The current price action and technical indicators offer a mixed but cautiously optimistic outlook for PI Network. The reclaiming of $0.13 as support is a positive development, indicating a potential bottoming out of the recent downtrend. The bullish divergence on the RSI is a strong signal that underlying buying interest is growing.
However, the low trading volume remains a significant caveat. For PI to achieve substantial and sustainable price growth, it will require broader market participation and increased confidence from investors. The upcoming price action around the $0.16 and $0.20 resistance levels will be critical in determining the short-term trajectory of the cryptocurrency.
The implications for the PI Network ecosystem are also noteworthy. A sustained price increase, coupled with increasing adoption and utility within its developing ecosystem, could attract more users and developers. Conversely, a failure to break through resistance levels and a subsequent price decline could dampen enthusiasm and hinder further development.
As PI Network continues its journey, the focus will remain on its ability to transition from its developmental phase to a fully functional and publicly traded cryptocurrency. The market will be watching closely for any official announcements regarding mainnet launch, exchange listings, and the expansion of its utility within the broader digital economy.
Disclaimer: This article provides an analysis of PI Network’s price based on technical indicators and market observations. It is important to note that the cryptocurrency market is highly volatile and speculative. Information presented here should not be considered financial advice. Investors are strongly advised to conduct their own thorough research and consult with a qualified financial advisor before making any investment decisions. The price data and predictions mentioned are based on current market conditions and are subject to change.