
Bitcoin, the world’s leading cryptocurrency, has experienced a significant deceleration in its upward trajectory after a rapid ascent from below $65,000 in mid-August to surpass $82,000 within a few weeks. This robust rally has now encountered substantial resistance, with BTC trading near $77,100 on Friday, positioned just beneath a formidable confluence of technical and on-chain barriers. An in-depth assessment by CryptoQuant, a prominent on-chain analytics firm, indicates that while the overarching trend appears constructive, the immediate path forward necessitates the clearing of several pivotal price levels by buyers to confirm a sustained bullish phase.
The immediate and most critical hurdle identified by CryptoQuant is a definitive close above the 365-day moving average, currently situated at $81,700. This specific threshold proved to be a decisive rejection point for Bitcoin’s early-September advance, halting its momentum and reinforcing its historical significance within CryptoQuant’s analytical framework. The firm posits that a successful and sustained breach above this moving average would not merely signify a temporary resistance break but would serve as a robust confirmation of a new bull-phase, signaling a potential shift in market dynamics towards more aggressive accumulation.
A Dense Barrier Emerges: The $77,100 to $81,700 Confluence
The current price range of Bitcoin is not merely facing arbitrary resistance lines; it is contending with a concentrated zone of supply largely influenced by long-term holders (LTHs). CryptoQuant’s analysis highlights that this cohort of investors, known for their strong conviction and tendency to hold through market volatility, engaged in significant selling activity during a 30-day window in 2026. This period saw LTHs divest as many as 539,000 BTC, with these sales predominantly occurring within the price band of $77,100 to $80,200. This historical selling activity has created a dense supply zone where previous holders, having exited their positions at these levels, may be inclined to sell back into any subsequent price rebounds, effectively capping upward momentum.
As Bitcoin’s price currently hovers at the lower end of this critical range, the market faces a fundamental challenge: demand must absorb this substantial overhead supply before any higher resistance levels can be effectively tested or overcome. This supply zone is strategically located just beneath the 365-day moving average, transforming the route to higher prices into a complex sequence of hurdles rather than a singular breakout event. Bitcoin has already demonstrated a failure to sustain momentum in this area, notably after its brief surge above $82,000 lost traction, confirming the potency of this resistance. Furthermore, CryptoQuant’s framework also tracks the 200-day moving average, positioned near $70,000, identifying it as the primary technical support level should selling pressure intensify and push the price downwards.

The significance of the $77,100 to $80,200 band extends beyond conventional chart patterns. It represents an aggregation of coins that were released into the market by investors who had held them steadfastly through earlier, often turbulent, market phases. The repeated testing of such supply zones can, over time, exhaust the available sell-side liquidity if persistent buying demand materializes. Conversely, failed rebounds, like the one recently observed, provide these same long-term holders with renewed opportunities to reduce their exposure, perpetuating the overhead pressure.
Should buyers successfully navigate the $81,700 average, two additional, albeit higher, resistance levels await. The three-times Metcalfe valuation band, a metric that derives network-value estimates from the number of active addresses, stands at $83,600. CryptoQuant characterizes this as a crucial valuation ceiling that buyers must decisively clear within the present price range. Beyond this, the trader realized price upper band, positioned at $88,700, represents another formidable resistance point. This final band tracks the aggregate cost basis of active traders, and historically, profit margins tend to widen significantly as spot prices approach this level, often coinciding with increased selling pressure as traders lock in gains. Consequently, a move through $81,700, while pivotal, would not by itself conclusively settle the question of a sustained Bitcoin price breakout.
ETF Flows and Their Influence: A Divergence in Institutional Sentiment
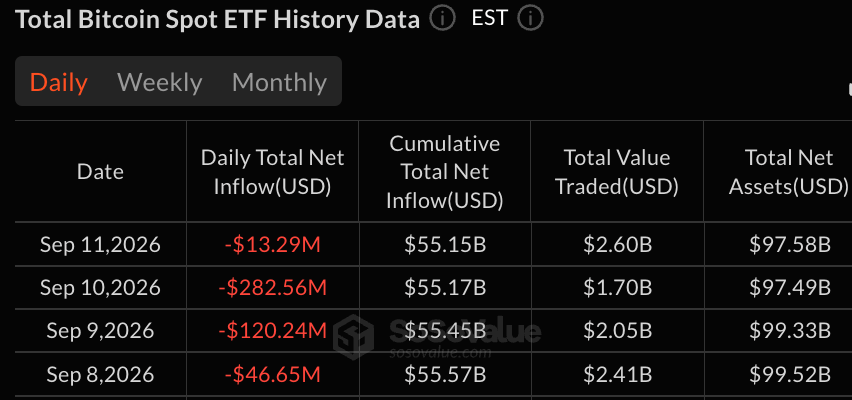
Adding another layer of complexity to Bitcoin’s current price dynamics are the recent trends in exchange-traded fund (ETF) flows, which provide a critical near-term signal regarding institutional demand. On Friday, U.S. Bitcoin ETFs recorded net withdrawals totaling $13.29 million, extending an unwelcome streak of four consecutive sessions of outflows. Over the course of the week, the collective group of Bitcoin ETFs experienced a significant loss of $462.73 million, despite a substantial $2.60 billion in traded volume. This sustained institutional selling pressure culminated in the net assets of these funds closing at $97.58 billion.
The fact that Bitcoin’s price remained anchored near $77,000 throughout this period of sustained withdrawals does not definitively prove a direct causal link between fund redemptions and the price retreat. However, it unequivocally demonstrates that recent institutional transactions failed to provide consistent demand at a time when Bitcoin was actively testing overhead supply. This situation stands in stark contrast to the performance of Ether funds, highlighting a notable divergence in institutional sentiment.
Ether ETFs, on the same Friday, registered impressive inflows of $216.41 million, marking their fourth consecutive week of net inflows. While this split in flows does not conclusively establish a direct rotation of capital from Bitcoin into Ether products, it strongly suggests that ETF demand has become increasingly selective. This selectivity coincides precisely with the identified overhead supply for Bitcoin and its failure to decisively clear the $81,700 resistance level. The implications are clear: institutional investors, through their ETF activity, are not uniformly bullish across the crypto market, and their caution regarding Bitcoin at these price levels is evident.
The 365-day moving average thus offers a clear and unambiguous reference point for Bitcoin’s next significant move. A strong, sustained close above $81,700 would not only invalidate the immediate resistance but would also firmly bring the $83,600 Metcalfe valuation ceiling into focus, potentially setting the stage for a test of the $88,700 trader realized price upper band. Conversely, a continued rejection at this critical level would ensure that the $77,100 to $80,200 supply zone remains active, trapping Bitcoin’s price within the same seller concentration that has consistently capped its latest rally attempts.
Downside Levels and Broader Market Implications
While the immediate focus remains on overhead resistance, potential downside levels also carry considerable weight and warrant careful monitoring. CryptoQuant identifies the next visible technical support at the 200-day moving average, positioned near $70,000. This level has historically served as a strong psychological and technical anchor, often attracting buyers during pullbacks.
Further below, a second significant on-chain accumulation cluster is situated between $62,000 and $65,000. This zone represents a substantial area where approximately 476,000 BTC accumulated earlier this year, indicating strong buyer conviction at these prices. A breakdown below the 200-day moving average could see Bitcoin testing this deeper accumulation zone, which would represent a more significant capitulation but also a potential area for a strong rebound if demand holds.
In summary, Bitcoin’s current market position is one of critical juncture. The immediate path forward is mapped by a sequence of formidable resistance levels: the $77,100 to $80,200 long-term holder supply zone, the pivotal 365-day moving average at $81,700, and the Metcalfe valuation band at $83,600. Buyers must systematically reclaim these levels to shift market sentiment and pave the way for a potential test of the $88,700 trader realized price upper band. Failure to do so could lead to a retest of key support levels, including the 200-day moving average at $70,000 and the deeper accumulation cluster between $62,000 and $65,000. The divergence in ETF flows further underscores the cautious institutional stance, adding another layer of complexity to Bitcoin’s immediate price outlook as the market awaits a decisive move.