
Ripple’s native cryptocurrency, XRP, is currently demonstrating a period of consolidation, holding firmly above the critical support level of $1.4. This price action has fueled speculation among market observers regarding its potential to challenge the next significant resistance at $1.6. The cryptocurrency’s recent performance suggests a potential shift in momentum, following a notable chart pattern breakout.
Technical Analysis and Key Levels
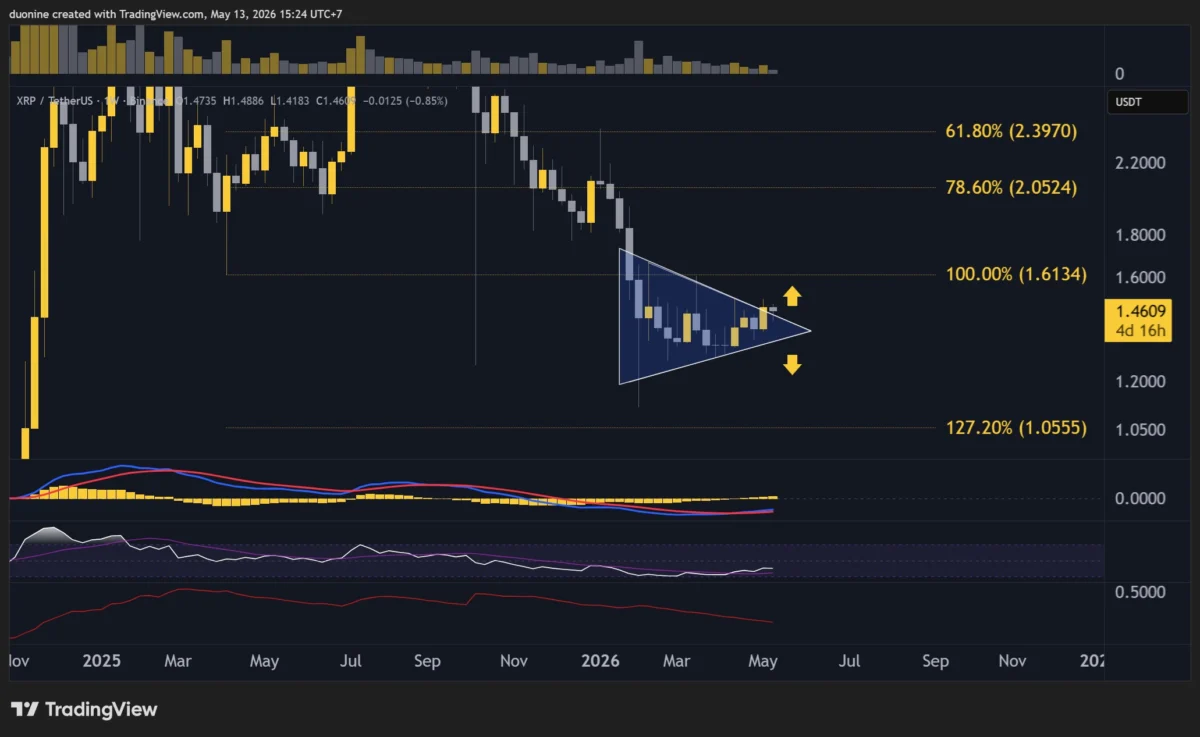
Technical indicators point to key support at $1.4, a level that has shown resilience in recent trading sessions. Conversely, significant resistance barriers are identified at $1.6 and a more substantial one at $2. The ability of XRP to maintain its footing above $1.4 is seen as a prerequisite for any upward movement towards these resistance zones.
The price action observed in the preceding days indicates that XRP has successfully defended its $1.4 support. This consolidation phase is often a precursor to a potential upward move, especially when coupled with specific chart formations. Market analysts are closely watching to see if this defensive posture will translate into a renewed push towards the $1.6 resistance.
Chart Pattern Breakout and Bullish Signals
A significant development for XRP has been its breakout from a “blue pennant” formation, a pattern often interpreted as a bullish signal in technical analysis. Pennants are typically continuation patterns, suggesting that after a period of consolidation and price convergence, the prevailing trend is likely to resume. The breakout from such a pattern, particularly when occurring after a period of price appreciation, can signal renewed buying interest.
However, the immediate aftermath of this breakout has been characterized by a somewhat subdued bullish momentum. While the pattern itself is considered a buy signal, the absence of a significant, immediate price rally suggests that broader market sentiment or specific investor conviction may still be developing. This cautious approach from buyers could be attributed to various factors, including market uncertainty, broader cryptocurrency trends, or specific news related to Ripple and XRP. Despite this initial lack of aggressive upward movement, the breakout remains a technically significant event, and its implications could unfold in the coming days and weeks as traders and investors assess the situation.
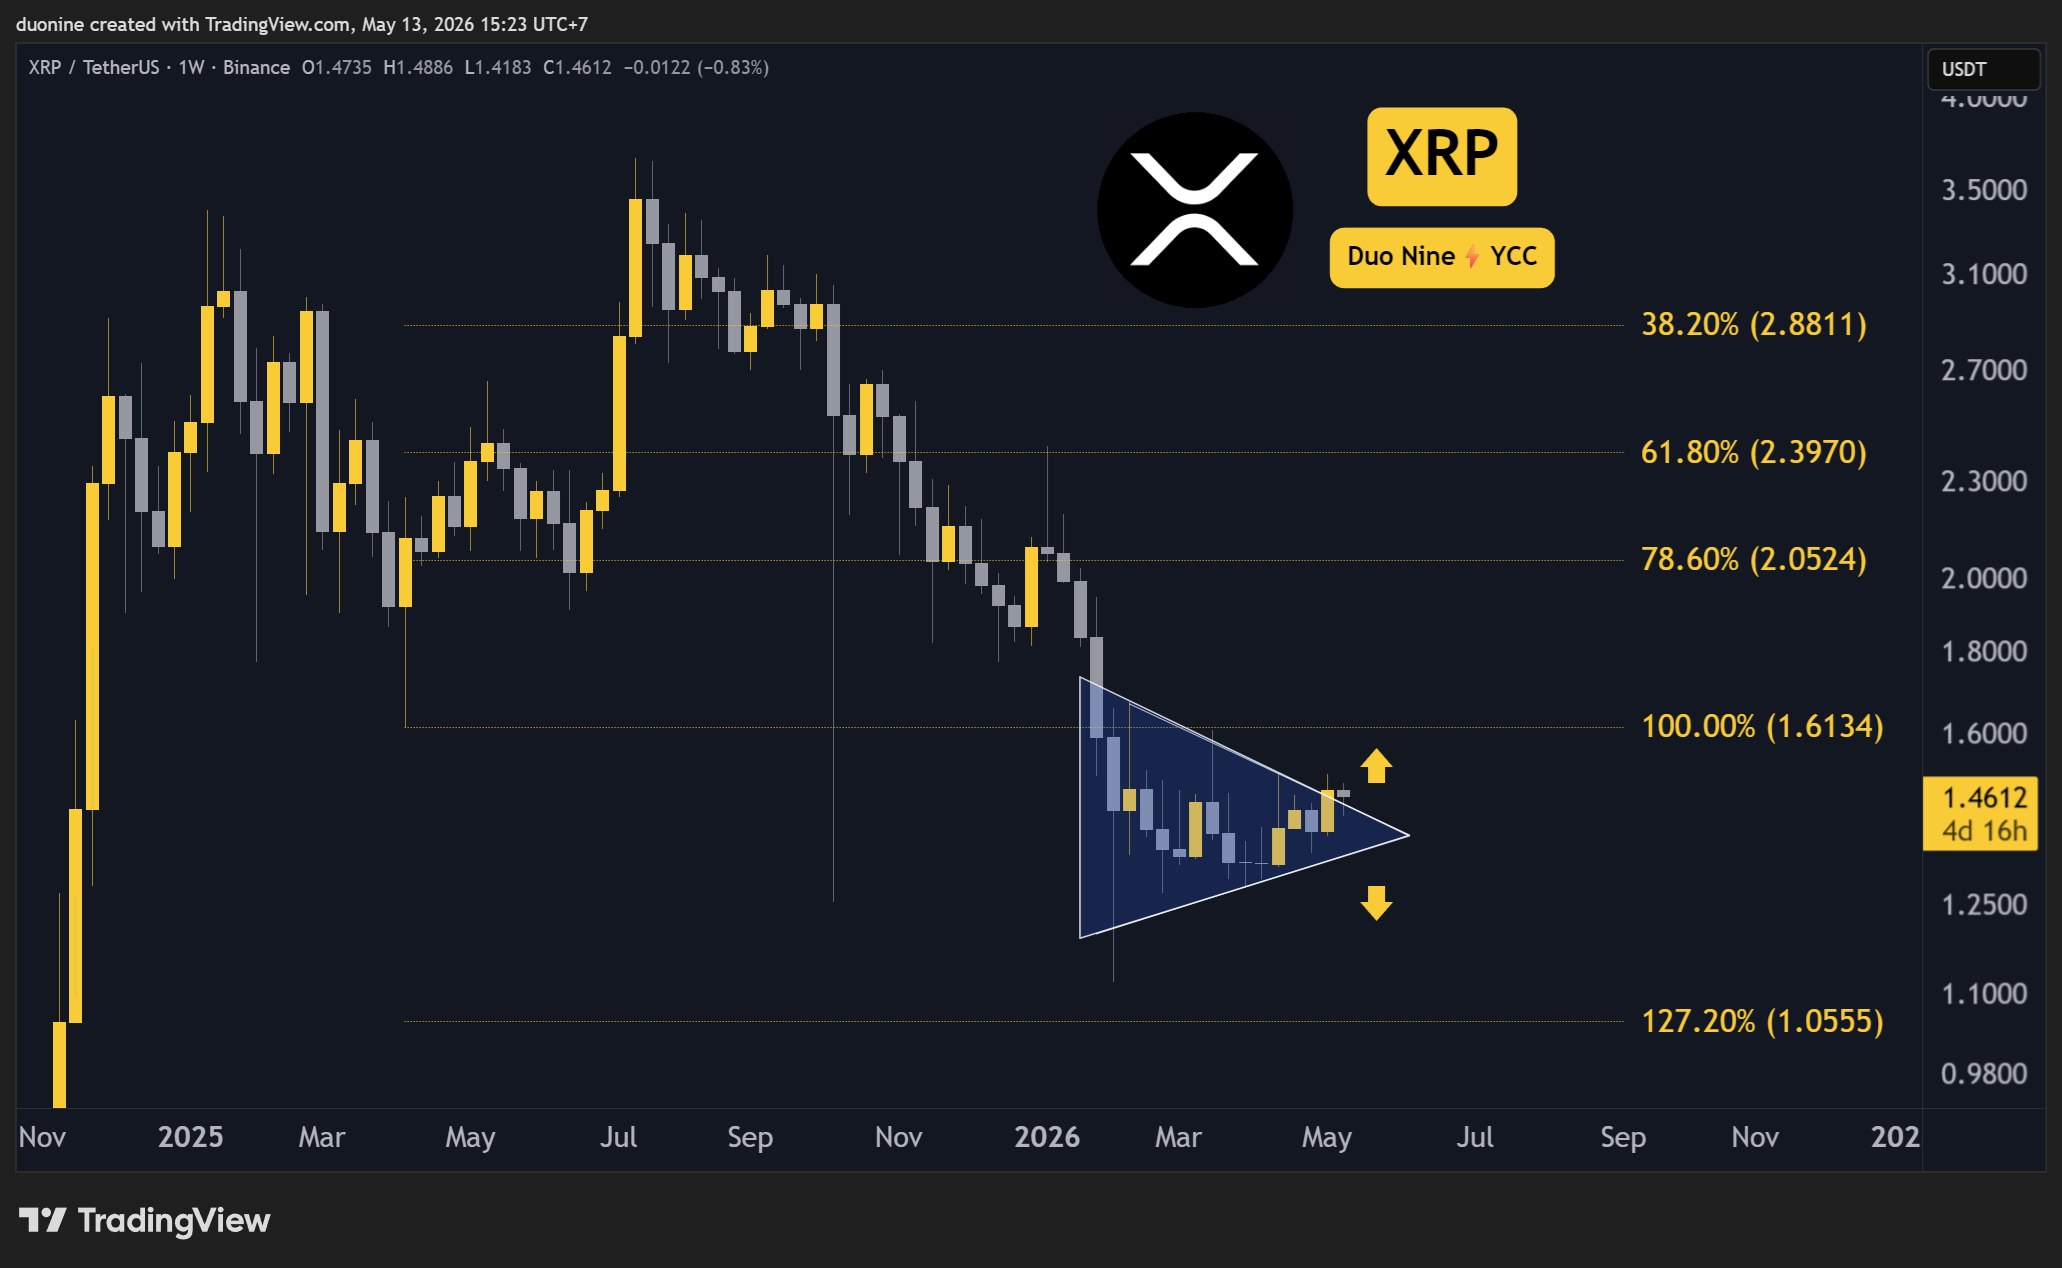
The visual representation of this technical pattern, as depicted in accompanying charts, shows a period of tight price action forming a pennant shape, followed by a decisive move upwards, breaking through the upper boundary of this formation. Such breakouts are closely scrutinized for their potential to trigger further price appreciation.
The Road to $1.6 and Beyond
The immediate objective for XRP, following its successful defense of the $1.4 support and the pennant breakout, appears to be the testing of the $1.6 resistance level. A decisive breach of this level could pave the way for a more substantial rally, potentially targeting the $2 mark.
While current bullish momentum might be described as "shy," as the original analysis suggests, this could change rapidly in the dynamic cryptocurrency market. A confirmed breakout above $1.6 would likely serve as a powerful catalyst, reinforcing positive sentiment and attracting a larger influx of buyers. This could create a snowball effect, driving the price higher as more participants seek to capitalize on the upward trend.
The indicators, as observed, suggest a bullish bias. However, the low trading volume accompanying this initial phase is a point of consideration. Low volume during a potential breakout can sometimes indicate a lack of strong conviction behind the move. For a sustained rally and a confident test of higher resistance levels, an increase in trading volume would be a crucial confirming factor. This would demonstrate that a significant number of market participants are actively engaging with XRP at these price levels, supporting the upward trajectory.
Deeper Dive into Technical Indicators: MACD Analysis
The weekly Moving Average Convergence Divergence (MACD) indicator provides further insight into XRP’s potential trajectory. The report highlights that the weekly MACD has continued to register higher histogram highs following the recent breakout. This ongoing pattern of increasing histogram highs on the weekly MACD is generally considered a strong bullish signal. It suggests that the upward momentum is strengthening over a longer timeframe, reinforcing the bullish outlook for XRP.
The MACD is a trend-following momentum indicator that shows the relationship between two moving averages of a security’s price. The MACD histogram represents the difference between the MACD line and its signal line. When the histogram is increasing and moving higher, it indicates that the bullish momentum is strengthening.
As long as this trend of higher histogram highs persists on the weekly MACD, the probability of XRP achieving higher prices remains elevated. This technical observation lends credence to the possibility of XRP moving beyond its current consolidation phase and challenging its resistance levels.
The Role of Volume and Market Conviction
The interplay between price action, technical indicators, and trading volume is critical in assessing the sustainability of any potential rally. While the MACD suggests a bullish leaning, the current low volume is a caveat that warrants attention. For XRP to convincingly break through the $1.6 resistance and move towards $2, an increase in trading volume is likely necessary.
This increase in volume would signal growing conviction among investors. When prices rise with significant volume, it suggests strong buying pressure and a collective belief in the asset’s upward potential. Conversely, a price increase on low volume can be less reliable, as it may be driven by a smaller number of traders and could be more susceptible to reversals.
The current situation can be interpreted as a preparatory phase. The technical signals are present, suggesting a potential for growth, but the market is awaiting further confirmation in the form of increased participation and sustained buying interest. If the price begins to climb, it could naturally attract more volume as traders jump on the bandwagon, reinforcing the bullish trend.
Broader Context and Potential Implications
The performance of XRP is often viewed within the broader context of the cryptocurrency market and the ongoing developments surrounding Ripple Labs. Ripple, the company behind XRP, has been involved in a protracted legal battle with the U.S. Securities and Exchange Commission (SEC). While the legal landscape remains a significant factor influencing XRP’s price, any positive developments or resolutions in this case could have a profound impact on investor sentiment and market dynamics.
The recent price action, independent of legal proceedings, suggests a technical setup that could lead to price appreciation. However, it is crucial to acknowledge that the cryptocurrency market is subject to various influences, including regulatory news, macroeconomic factors, and overall market sentiment.
If XRP does successfully break through the $1.6 resistance, it would not only be a technical achievement but could also signal a renewed confidence in the asset. This could lead to increased adoption and utility for XRP in its intended use cases, such as cross-border payments and remittances. The technology underlying XRP, designed for speed and efficiency in financial transactions, continues to be a point of interest for financial institutions.
Historical Performance and Future Outlook
Historically, XRP has experienced significant volatility, with periods of rapid price surges followed by sharp corrections. Understanding these past patterns can provide valuable context for current analysis. The cryptocurrency has a dedicated community of holders and a strong presence in the altcoin market.
The current consolidation phase, while potentially signaling a period of indecision, also presents an opportunity for accumulation for those who believe in XRP’s long-term potential. The key resistance levels of $1.6 and $2 are not arbitrary; they represent psychological and technical barriers that have historically played a role in price movements. Breaking through these levels would require sustained buying pressure and a positive shift in market sentiment.
The coming weeks will be critical in determining whether XRP can capitalize on its current technical setup. Investors and traders will be closely monitoring trading volumes, broader market trends, and any news that could influence XRP’s trajectory. The defense of the $1.4 support and the breakout from the pennant formation are positive signs, but the true test will lie in the ability of buyers to exert sustained pressure and overcome the $1.6 resistance. Should this occur, the path towards $2 would become a more tangible prospect, potentially marking a significant turning point for the cryptocurrency.
The analysis of momentum indicators, like the MACD, coupled with price action, suggests that the underlying sentiment may be leaning towards bullishness. However, the market is a complex ecosystem, and the confluence of technical factors, fundamental developments, and broader economic conditions will ultimately dictate XRP’s price performance in the short to medium term. The consolidation above $1.4 is a promising sign, but the market awaits the decisive move that will confirm whether XRP is indeed poised for a significant upward trend.