

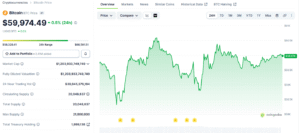
The most pressing question currently dominating the cryptocurrency landscape is whether Bitcoin has finally established its cycle bottom. According to Ki Young Ju, CEO of the prominent on-chain analytics firm CryptoQuant, the answer, based on a comprehensive analysis of on-chain data, unequivocally remains no. His detailed argument hinges primarily on the metric known as realized price, a fundamental indicator that reflects the aggregate cost basis of all circulating Bitcoin, weighted by the last time each coin moved on the blockchain. As of recent market observations, Bitcoin has been trading around the $59,974 mark, experiencing a modest 0.5% uptick over a 24-hour period but a more significant 5.46% decline over the preceding seven days, keeping the intense debate surrounding a definitive market bottom very much alive among investors and analysts alike.
Understanding Realized Price as a Key Cycle Indicator
Realized price has historically served as a critical final checkpoint before Bitcoin confirms a sustained bear market floor and embarks on a new recovery phase. This powerful on-chain metric is calculated by valuing each Bitcoin at the price it was last transacted on-chain, then averaging these values across the entire supply. Unlike the market price, which is determined by the last trade on an exchange, realized price offers a glimpse into the average acquisition cost of all investors, providing a more robust measure of the market’s collective profit or loss. When the spot price approaches or falls below the realized price, it signals that the average investor is holding an unrealized loss, a condition often associated with peak capitulation events.
During previous major market cycles—specifically in 2015, 2018, and 2022—Bitcoin’s spot price demonstrated a consistent pattern. It would typically either converge with or briefly dip below the realized price level before any meaningful and sustained recovery could take hold. For instance, in the bear market of 2015, Bitcoin’s price eventually found its bottom after spending a significant period near its realized price, which was then considerably lower than its peak. Similarly, the brutal 2018 bear market saw Bitcoin plunge from nearly $20,000 to approximately $3,200, with its price briefly dipping below its realized price (which was around $6,000 at the time) before a multi-year accumulation phase began. More recently, the 2022 bear market witnessed Bitcoin fall below its realized price, which hovered around the $20,000-$22,000 range, signifying a period of intense financial stress for many holders. These historical junctures were characterized by widespread unrealized losses across the network, typically preceding the most significant accumulation phases of each respective cycle, where savvy long-term investors began to buy from distressed sellers.
Ki Young Ju emphasizes that the risk-reward profile for investors tends to improve dramatically as Bitcoin’s price approaches this crucial cost basis. His extensive analysis of past market behavior reveals that every major cycle bottom has previously seen the spot price either touch or fall below the realized price. Despite a substantial pullback from its 2024 highs, Bitcoin’s current trading value remains above this critical threshold. This discernible gap between the current market price and the realized price is precisely what Ju identifies as "unfinished business" within the ongoing bear phase, suggesting that the market has not yet experienced the full extent of capitulation historically associated with a true bottom.
Ki Young Ju’s Analysis and the "Unless This Time is Different" Caveat
Ki Young Ju’s analytical framework is rooted in the empirical observation of Bitcoin’s past market cycles. He warns market participants that "unless this time is different," Bitcoin may still need to experience further downward pressure before a true cycle bottom can definitively form. This phrase, "this time is different," carries significant weight within crypto circles, often serving as a cautionary tale for those who dismiss historical patterns in favor of optimistic, short-term narratives. Over the years, countless investors have learned costly lessons by ignoring established market dynamics and believing that prevailing conditions somehow exempt an asset from its historical tendencies.
His logarithmic chart analysis, a common tool for visualizing long-term price trends and volatility, further supports his cautious outlook. Ju contends that the current market structure simply does not yet exhibit the characteristic patterns and confluence of indicators typically observed during previous confirmed bottoms. These patterns often include prolonged periods of consolidation at extremely low prices, significant volume spikes indicative of capitulation, and specific on-chain behaviors such as massive transfers of coins from short-term to long-term holders. The absence of these familiar hallmarks, according to Ju, reinforces the idea that the market is still in a state of flux, without having reached its nadir.

However, Ju thoughtfully adds a crucial caveat: if Bitcoin does not touch its realized price in the current cycle, it could signal a fundamental shift in market dynamics. This nuanced perspective leaves room for the emergence of a new bottoming structure, one potentially driven by forces that were either nascent or non-existent in prior cycles. Key among these new forces are the introduction of spot Bitcoin Exchange Traded Funds (ETFs) and the substantial growth in institutional custody flows, which have dramatically altered the market’s liquidity, participant base, and overall infrastructure. This acknowledgment is vital, as it prevents dogmatic adherence to historical models while still emphasizing their importance.
The Evolving Landscape: Institutionalization and Market Maturity
Indeed, today’s Bitcoin market operates within a vastly different institutional framework compared to any previous bear phase. The launch of spot Bitcoin ETFs in the United States in January 2024 marked a watershed moment, providing traditional investors with a regulated and easily accessible avenue to gain exposure to Bitcoin without directly holding the asset. These ETFs, alongside established corporate treasury programs (exemplified by companies like MicroStrategy accumulating vast amounts of Bitcoin) and sophisticated derivatives desks, now collectively absorb selling pressure in ways that were previously unimaginable. This robust institutional infrastructure can, theoretically, prevent the kind of extreme capitulation and liquidity vacuums that characterized earlier cycles.
This structural transformation may well explain why the realized price has not yet been thoroughly tested, despite several months of declining prices and heightened volatility since Bitcoin’s all-time high in March 2024. The presence of institutional buyers who are less prone to panic selling and more focused on long-term accumulation strategies could be providing a higher floor for Bitcoin’s price. Unlike retail investors who might be forced to sell during sharp downturns due to margin calls or emotional responses, institutional entities often have longer investment horizons and deeper pockets, allowing them to "buy the dip" and stabilize prices.
Ki Young Ju points out that despite elevated selling pressure and a notable increase in realized capitalization (the sum of all coins valued at their realized price), Bitcoin’s price has fallen without yet hitting the realized price threshold. This observation suggests that the selling pressure might primarily represent a shift in holdings among existing investors, rather than a significant influx of genuine new demand entering the market. In other words, long-term holders might be selling to new short-term holders, or weak hands are capitulating to stronger hands, but without substantial fresh capital flowing in from outside the existing ecosystem. This interpretation implies a market still undergoing distribution and consolidation, working through a supply overhang, rather than one that has cleared its decks and is ready for a sustained ascent.
Recent Market Dynamics and Price Action
Bitcoin’s journey since its all-time high of approximately $73,798 in March 2024 has been marked by significant volatility and a notable pullback. After reaching this peak, the cryptocurrency entered a corrective phase, driven by various factors including profit-taking, macroeconomic uncertainties, and a rotation of capital within the broader financial markets. Throughout April and May, Bitcoin experienced several sharp drops, notably plunging below the $60,000 mark on multiple occasions. These downturns were often exacerbated by hawkish commentary from central banks regarding inflation, geopolitical tensions, and liquidations in the derivatives market.
The market has since seen attempts at recovery, with Bitcoin briefly pushing back towards the $61,000 level. However, these bounces have largely been characterized as "relief rallies" rather than confirmed reversals. The price action suggests a battle between buyers and sellers around key psychological and technical support levels. For instance, the $60,000 area has repeatedly acted as both support and resistance, indicating a critical zone where market participants are actively debating Bitcoin’s near-term direction. The overall sentiment, despite some intermittent positive movements, remains cautious, with many analysts highlighting the lack of sustained buying volume necessary to break out of the current consolidation range and reclaim previous highs. The absence of a clear bottom, as articulated by Ki Young Ju, contributes to this lingering uncertainty.
Conflicting Signals and a Multi-faceted Approach to Bottom-Timing
The complexity of timing a market bottom is further highlighted by conflicting signals even within the same analytical firm. CryptoQuant’s own Bull-Bear Cycle Indicator, a composite metric designed to assess the overall market sentiment and phase, notably turned green on May 12, 2024. This signal, which typically aligns with the onset of more constructive market conditions and potential accumulation phases, runs counter to Ju’s longer-term PnL (Profit and Loss) framework based on realized price. Such discrepancies underscore the inherent difficulty and multi-faceted nature of market analysis, where no single metric can provide a definitive answer. Different indicators, relying on distinct methodologies and data inputs, can often present divergent views, requiring analysts to synthesize information from various sources.
Consequently, a holistic approach is essential for a comprehensive understanding of Bitcoin’s true demand and potential bottoming process. Analysts tracking a broader spectrum of on-chain and off-chain data points typically consider:
- ETF Flows: Monitoring daily inflows and outflows from spot Bitcoin ETFs provides crucial insights into institutional and retail sentiment. Significant net inflows indicate strong buying interest, while sustained outflows can signal selling pressure. Recent data has shown fluctuating flows, with periods of both strong accumulation and net outflows, contributing to price volatility.
- Coinbase Premium: This metric measures the price difference between Bitcoin on Coinbase (often favored by institutional investors in the US) and other global exchanges. A persistent positive premium suggests robust institutional buying demand in the US market, whereas a negative premium might indicate selling pressure.
- Stablecoin Liquidity: The amount of stablecoins held on exchanges represents potential buying power. An increase in stablecoin reserves can signal that investors are preparing to deploy capital into cryptocurrencies, while a decrease might suggest capital withdrawal or deployment into other assets.
- Miner Selling Activity: Following the Bitcoin halving in April 2024, which reduced block rewards by 50%, miners faced increased pressure on their profitability. Monitoring miner outflows to exchanges can indicate whether they are selling their holdings to cover operational costs or upgrade equipment, which can add to market supply.
- Long-Term Holder (LTH) Behavior: On-chain data allows for tracking the accumulation and distribution patterns of long-term holders (entities holding Bitcoin for more than 155 days). When LTHs accumulate, it’s often a bullish signal, whereas significant distribution can indicate profit-taking or capitulation.
By integrating these diverse data points alongside the realized price, market participants can construct a fuller, more nuanced picture of true demand and supply dynamics. Bitcoin’s recent recovery toward $61,000, as previously mentioned, has largely been interpreted as a relief bounce within a broader consolidation phase rather than a confirmed reversal. The key question for market participants remains whether underlying demand is robust enough to sustain such moves or if renewed selling pressure will emerge around critical liquidity zones.
The Significance of "Genuine New Demand" and Implications for Investors
The distinction between a mere "shift in holdings among existing investors" and the entry of "genuine new demand" is paramount for determining a confirmed market bottom. A market where existing holders are simply trading amongst themselves, even if it leads to price stability, lacks the organic growth necessary for a sustained bull run. Genuine new demand, typically characterized by fresh capital flowing into the ecosystem from outside, signifies expanding adoption and a broadening investor base. This influx of new capital is what ultimately fuels significant price appreciation and validates a market bottom.
For investors, the current unconfirmed bottom implies a period of heightened risk and continued uncertainty. Without the historical validation of the realized price being tested, or without clear signs of substantial new capital entering the market, the potential for further downside remains a significant concern. The implications are multi-faceted:
- For Long-Term Investors: A potential further dip to the realized price could present an even more attractive accumulation opportunity, aligning with historical patterns of optimal risk-reward entry points. However, waiting for this confirmation means potentially missing out on a recovery if "this time is different."
- For Short-Term Traders: The current environment calls for extreme caution. The market is prone to sudden swings, and relief rallies can quickly dissipate without underlying demand. Identifying key support and resistance levels, alongside monitoring on-chain metrics, becomes crucial for managing risk.
- For Market Structure: If Bitcoin manages to bottom without touching its realized price, it would indeed mark a significant evolution in its market structure. It would suggest that institutional participation has fundamentally altered the asset’s volatility profile, potentially leading to shallower bear markets and higher lows in future cycles. This would be a bullish long-term development, but one that challenges established analytical models.
Conclusion
The debate over Bitcoin’s cycle bottom remains one of the most compelling narratives in the cryptocurrency space. While Ki Young Ju’s analysis, grounded in the historical reliability of the realized price metric, suggests that further price action may be necessary to confirm a true bottom, the evolving institutional landscape introduces a unique variable into the equation. The presence of spot ETFs, corporate treasuries, and sophisticated derivatives markets may indeed be creating a new paradigm where extreme capitulation to the realized price is less likely.
However, until fresh capital visibly enters the market, moving beyond a mere redistribution of existing holdings, the question of a confirmed bottom will persist. Investors and analysts will continue to meticulously monitor a confluence of on-chain data points—from ETF flows and stablecoin liquidity to miner activity and the behavior of long-term holders—to gain a clearer picture. The current market environment underscores the intricate interplay of historical patterns, new market participants, and macroeconomic forces, making the current Bitcoin cycle one of the most fascinating and complex to navigate. The ultimate answer to whether "this time is different" will only be revealed by future price action and the enduring resilience of Bitcoin’s market structure.