Tesla stock (NASDAQ: TSLA) concluded its latest trading session with a marginal gain, yet failed to sustain an initial ascent above the psychologically significant $400 mark, leaving investors and analysts scrutinizing its technical posture. The session’s close revealed a landscape of weak momentum, with key technical indicators pointing to a lack of strong directional conviction. Competing short-term and longer-term price structures identified by various traders further underscore the current ambiguity surrounding the electric vehicle (EV) giant’s shares. As a result, TSLA stock remains confined within a relatively narrow trading range, compelling market participants to carefully assess established support and resistance levels alongside potential breakout signals. This period of consolidation highlights a critical juncture for Tesla, as its stock grapples with a confluence of technical headwinds and broader market dynamics.
The Day’s Trading Unpacked: A Battle for the $400 Mark
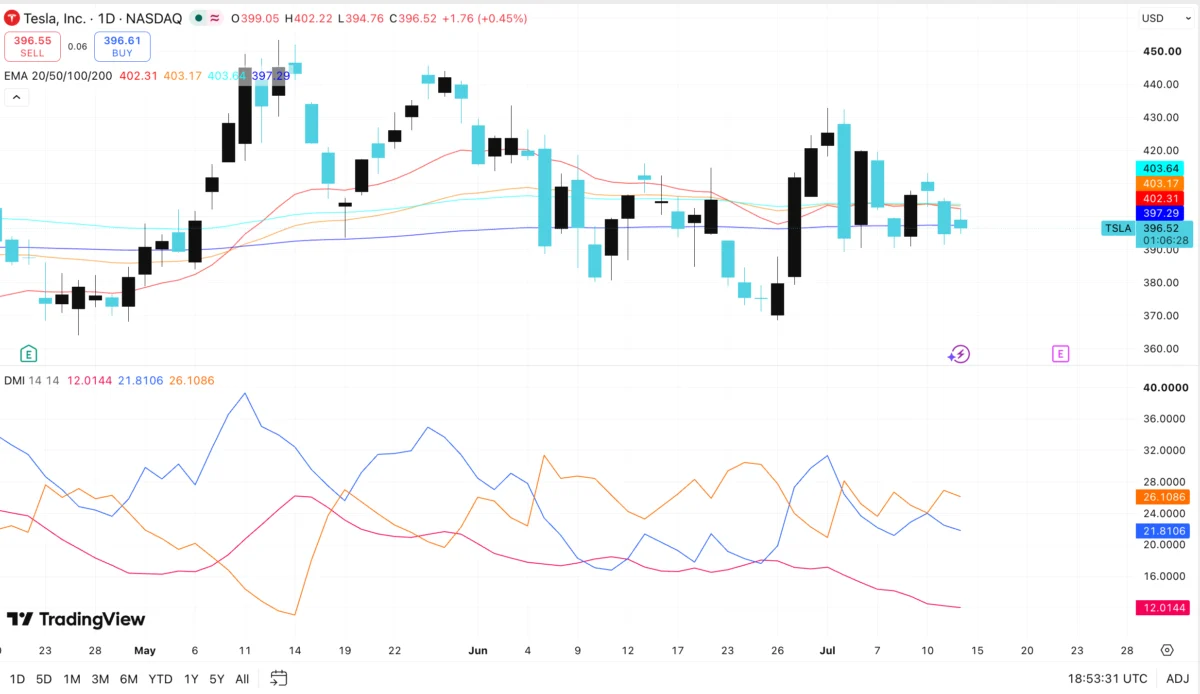
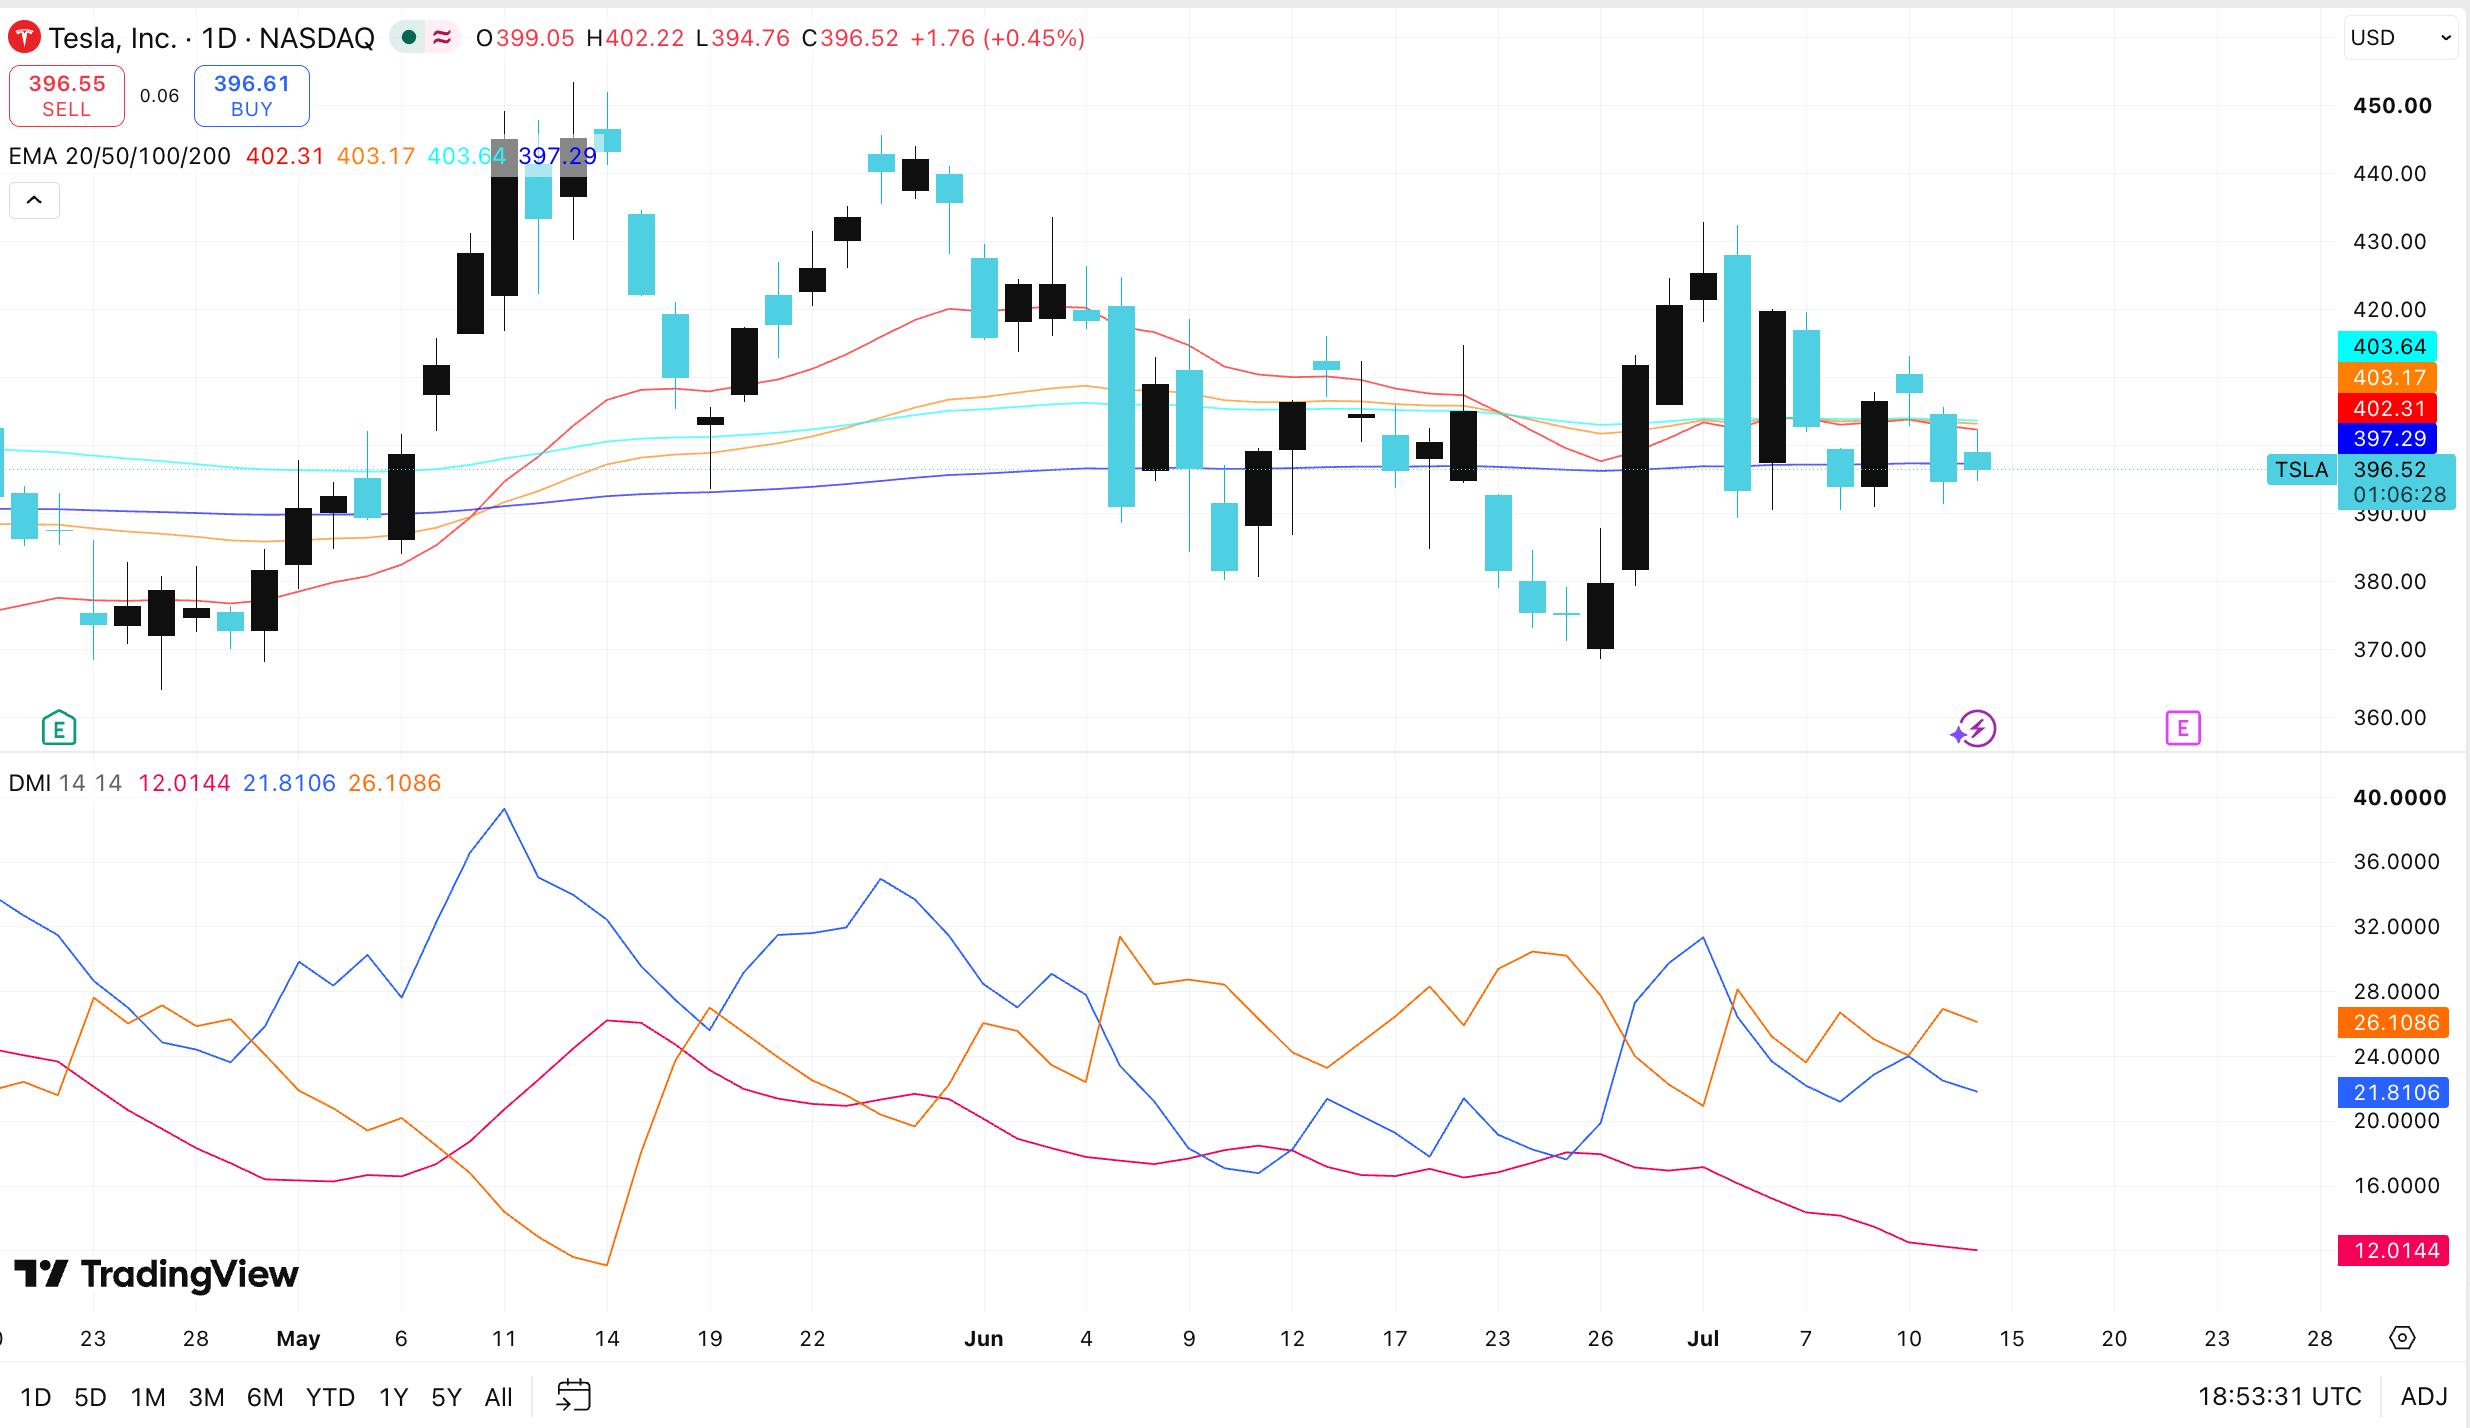
On the day in question, Tesla shares registered a modest increase of 0.45%, ultimately settling at $396.52, according to the latest TradingView market data. The trading day commenced with an optimistic tone, as TSLA opened at $399.05, immediately signaling an attempt to reclaim higher ground. This initial buying momentum propelled the stock to an intraday high of $402.22, momentarily breaching the crucial $400 threshold. However, this upward thrust proved to be ephemeral. As the session progressed, a discernible selling pressure emerged, gradually eroding the early gains. Sellers asserted their influence, pushing the price back down to an intraday low of $394.76 before the closing bell, firmly placing the stock beneath its earlier peak and below the coveted $400 level. This intraday reversal underscores the prevailing cautious sentiment among traders, where rallies are met with swift profit-taking or renewed bearish activity, preventing any sustained upward movement. The trading volume, while not explicitly detailed in the immediate data, was observed to be moderate, suggesting that neither buyers nor sellers demonstrated overwhelming conviction to decisively move the price in either direction, a characteristic often seen during periods of market indecision and consolidation.
Technical Indicators Signal Indecision: A Confluence of Resistance
A deeper dive into Tesla’s technical landscape reveals a series of challenging indicators for the bulls. The stock’s closing price of $396.52 placed it squarely below a cluster of critical short-term and medium-term exponential moving averages (EMAs). Specifically, TSLA ended the session beneath its 20-day, 50-day, and 100-day EMAs, which currently reside in a tight band between $402.31 and $403.64. This concentration of moving averages creates a formidable resistance zone, acting as a significant barrier that the stock struggled to overcome during its intraday rally. The inability to hold above these averages, particularly after touching $402.22, suggests that overhead supply remains substantial, with sellers quick to capitalize on any upward price action. Furthermore, the shares also closed below the longer-term 200-day exponential moving average, positioned at $397.29. The 200-day EMA is widely regarded as a key benchmark for assessing a stock’s long-term trend; a close below it often signals a shift towards a more bearish bias or at least a period of prolonged weakness. The fact that TSLA is trading beneath all these prominent moving averages paints a picture of technical vulnerability, indicating that the path of least resistance, for now, leans towards the downside or continued sideways movement.
Momentum and Trend Strength Analysis: The Absence of Strong Direction
Beyond the static resistance offered by moving averages, dynamic momentum indicators further reinforce the narrative of indecision. The Directional Movement Index (DMI), a tool used to assess trend direction and strength, currently presents a mild bearish tilt for TSLA stock. The negative directional indicator (-DI) stands at 26.11, notably exceeding the positive directional indicator (+DI) reading of 21.81. This differential suggests that sellers held a modest, albeit not overwhelming, advantage over buyers during the measured period. While not indicative of a precipitous decline, it certainly highlights the prevailing bearish pressure within the current trading environment.

Crucially, the Average Directional Index (ADX), which quantifies the strength of a trend regardless of its direction, registered a notably low reading of only 12.01. An ADX value below 20 typically signifies the absence of a strong trend, indicating that neither buyers nor sellers are currently in firm control of the market’s direction. This low ADX reading is a key piece of information, as it explains the stock’s tendency to remain range-bound despite the slight bearish bias from the DMI. It implies that price compression is likely to persist, with the stock oscillating between established boundaries until a significant catalyst emerges to inject stronger directional momentum and conviction into trading activity. The Relative Strength Index (RSI), another widely observed oscillator that gauges overbought or oversold conditions, also hovered near the neutral 50-mark. This balanced reading further supports the notion that neither buyers nor sellers are exerting dominant pressure, aligning with the ADX’s message of equilibrium. Similarly, the Moving Average Convergence Divergence (MACD) oscillator displayed flattening lines, with its signal line showing little deviation, reflecting the absence of clear directional momentum. These combined technical signals underscore a market awaiting a decisive trigger, rather than one driven by strong underlying conviction.
Critical Price Levels and Structural Boundaries: Defining the Range
Given the prevailing technical landscape, immediate resistance for TSLA stock now spans approximately $397 to $404, encompassing the cluster of moving averages and the recent intraday high. This zone represents a significant hurdle that bulls must convincingly overcome to signal a potential shift in sentiment. On the support side, nearby strength remains at the intraday low of $394.76. A more critical lower support zone is identified near $390, a level that traders have recognized as an important structural point. This $390 level holds psychological and technical significance, as a sustained breach below it could invalidate current support structures and expose the stock to further downside risk.
Therefore, for TSLA stock to establish a clearer direction and break free from its current consolidation pattern, a decisive move beyond either the $404 resistance ceiling or the $390 support floor is imperative. A strong breakout above $404, ideally accompanied by increased trading volume, would place the shares above several closely grouped moving averages, potentially signaling a renewed bullish impetus and targeting higher resistance levels. Conversely, a sustained drop below $390 would significantly weaken the existing market structure, confirming increased bearish control and potentially exposing lower support areas, inviting further selling pressure. Until such a decisive event materializes, the stock is likely to continue its oscillation within these established nearby support and resistance levels, frustrating both bullish and bearish camps seeking a clear trend.
Broader Market Context and Sector Dynamics: External Pressures
Tesla’s recent price action does not occur in a vacuum. The broader market environment, particularly within the technology and electric vehicle sectors, significantly influences TSLA’s performance. The Nasdaq Composite, which houses many growth-oriented tech stocks, has experienced periods of heightened volatility in recent weeks, driven by macroeconomic concerns such as persistent inflation, the trajectory of interest rates, and geopolitical tensions. Growth stocks like Tesla are particularly sensitive to rising interest rates, as higher borrowing costs can impact future earnings projections and make their often-high valuations less attractive to investors seeking immediate returns.
Furthermore, the EV market itself is undergoing significant transformations. While Tesla remains a dominant player, competition is intensifying rapidly. Established automotive giants are pouring billions into their own EV initiatives, and new entrants are emerging globally. This increased competition, coupled with potential challenges in global supply chains and evolving consumer demand, adds another layer of complexity to Tesla’s market perception. Reports of "new ex-Elon ETFs" launching to exclude Tesla and SpaceX from their holdings hint at a segment of the market seeking exposure to the EV sector without the perceived volatility or idiosyncratic risks associated with CEO Elon Musk’s public persona and ventures. This phenomenon suggests a maturing market where investors are increasingly discerning about their exposure to individual companies and their leadership, even for a trailblazer like Tesla. These external pressures contribute to the cautious sentiment and technical stalemate observed in TSLA’s stock performance.
Tesla’s Recent Operational and Strategic Landscape: Underlying Fundamentals
While the immediate focus of this analysis is technical, it is crucial to briefly acknowledge Tesla’s operational and strategic landscape, as these underlying fundamentals inevitably shape investor sentiment. Tesla continues to be a leader in EV innovation, with ongoing developments in its Full Self-Driving (FSD) software and advancements in battery technology. Recent announcements or hints from Elon Musk regarding FSD upgrades often generate buzz, but their impact on stock price can be fleeting without concrete financial implications. Production figures, delivery numbers, and margin trends from quarterly earnings reports are pivotal catalysts that can override technical patterns. Any perceived slowdown in production growth, increased competition in key markets like China, or shifts in pricing strategy to maintain market share can weigh heavily on investor confidence. The company’s ambitious expansion plans, including new gigafactories and product lines, require significant capital and flawless execution, keeping investors attentive to every corporate announcement. The current technical indecision could be seen as the market’s way of waiting for a clear fundamental signal or a significant shift in the broader economic narrative before committing to a strong directional move.
Divergent Interpretations from Technical Analysts: A Spectrum of Scenarios
The current consolidation in TSLA stock has naturally attracted a variety of interpretations from technical analysts, each offering a distinct perspective on its potential future trajectory.
One intriguing viewpoint comes from CoinvoTrading, who described the recent decline near $400 as a possible "bear trap" within a broader "psychological cycle." This analysis, typically applied to longer timeframes, suggests that the market often moves through predictable phases: euphoria, optimism, anxiety, capitulation, and finally recovery. According to CoinvoTrading’s daily chart projection, the stock may currently be in a "recovery + bull trap" phase following earlier periods of anxiety and capitulation. This perspective posits that many traders might be fading the stock prematurely, just before a potential significant upward explosion. The "bear trap" implies that short-sellers or pessimistic traders are being lured into positions that will soon reverse against them, setting the stage for a powerful short squeeze or renewed buying interest.
Meanwhile, @EWTracker presented an Elliott Wave-based analysis, placing TSLA stock inside a multi-month symmetrical consolidation triangle. The Elliott Wave theory posits that market prices move in discernible wave patterns, often in repetitive fractal structures. In this interpretation, the current price action is situated near the middle of this large triangular formation, rather than approaching either its upper resistance or lower support boundary. According to @EWTracker’s analysis, this prolonged consolidation could delay a confirmed breakout until as late as September or October. The flexibility of such patterns means that the market could extend the delay through repeated tests of both the top and bottom trendlines, keeping traders guessing. This view suggests that patience is key for long-term investors, while short-term traders might find opportunities selling options premium (e.g., selling puts) around the triangle’s boundaries, anticipating continued range-bound movement.
A third perspective, offered by @optionflys on the one-hour chart, highlights a tighter compression pattern between descending resistance and rising support. This type of formation, often referred to as a "symmetrical triangle" or "wedge" on shorter timeframes, indicates narrowing price action as buying and selling pressures become increasingly balanced. @optionflys identified specific levels for a potential breakout: a move above the trendline would open the door toward $413, followed by $420, suggesting a bullish bias if resistance is overcome. Conversely, a fall below $389.30 would invalidate the current bullish structure, implying a breakdown towards lower support levels. The key takeaway from this analyst, echoing a fundamental principle of technical trading, is "Don’t predict the breakout. Let price make the decision." This emphasizes reactive trading, waiting for confirmation of a move rather than anticipating it. These divergent, yet complementary, technical analyses underscore the complexity and the current state of uncertainty surrounding TSLA’s near-term price direction.
Implications for Investors and Traders: Navigating the Uncertainty
The current technical stalemate and the differing analytical perspectives present distinct implications for various types of market participants. For short-term traders and day traders, the narrow range between $390 and $404 (or even the tighter $394-$404 band) offers limited opportunities for significant directional plays. Such periods often favor strategies like scalping, where traders aim to profit from small price fluctuations within the range, or disciplined range-bound trading, buying near support and selling near resistance. However, the lack of strong momentum (as indicated by the low ADX) also means that breakouts, when they occur, might lack immediate follow-through, increasing the risk of "fakeouts" or traps. Robust risk management and tight stop-losses are paramount in such an environment.
For swing traders, who typically hold positions for days or weeks, the multi-month consolidation triangle suggested by @EWTracker implies that patience is a virtue. They might be looking to establish positions closer to the triangle’s boundaries or await a confirmed breakout on higher timeframes before committing significant capital. The potential for prolonged sideways movement until September or October means that capital might be tied up for extended periods without substantial returns.
Long-term investors, on the other hand, might view this period of consolidation as an opportunity or a waiting game. Those bullish on Tesla’s long-term growth trajectory might see dips towards the lower support levels (e.g., $390 or below) as potential accumulation points, provided their fundamental outlook remains strong. Conversely, investors concerned about broader market headwinds or increased competition might use any rallies towards resistance to trim positions or re-evaluate their exposure. The absence of a clear trend on daily and weekly charts suggests that new significant capital deployments from long-term institutional investors might be on hold, awaiting clearer signals from earnings, product announcements, or macroeconomic shifts.
Across all investor profiles, the common thread is the need for caution and confirmation. The "don’t predict the breakout, let price make the decision" mantra becomes particularly relevant. Acting solely on anticipation in a low-momentum, range-bound market can lead to significant losses. Instead, market participants are encouraged to wait for a decisive move, backed by increased volume, above key resistance or below critical support, before committing to a strong directional bias.
Outlook: Awaiting a Decisive Catalyst
Ultimately, TSLA stock finds itself at a pivotal juncture, oscillating within defined technical boundaries as it awaits a catalyst strong enough to break the current equilibrium. The failure to hold above $400, coupled with weak momentum indicators and a confluence of resistance from key moving averages, paints a picture of a stock under pressure. While some technical analysts point to potential bullish reversals or prolonged consolidation, the immediate reality is one of indecision.
Potential catalysts that could decisively break this stalemate include upcoming quarterly earnings reports, which will provide crucial insights into Tesla’s production, delivery figures, profit margins, and future guidance. Any major announcements regarding new product lines, significant advancements in FSD technology, or strategic shifts in global markets could also inject volatility and direction. Beyond company-specific news, broader macroeconomic data, such as inflation reports, interest rate decisions from central banks, or shifts in consumer spending habits, will continue to influence investor sentiment towards growth stocks like Tesla. Until such a decisive event or a clear technical breakout materializes with conviction volume, TSLA stock is likely to remain range-bound, continuing its intricate dance between nearby support and resistance levels. The market, for now, holds its breath, patiently awaiting a clear signal for the next significant move from the electric vehicle behemoth.