The cryptocurrency market, known for its inherent volatility and rapid shifts, is currently observing the price action of PI Network (PI) with a keen eye. Recent trading sessions have seen PI find tentative support around the $0.15 mark. However, the critical question remains: can this support level hold, or will the downward trend continue to assert its dominance? This analysis delves into the current technical indicators, historical price movements, and potential implications for PI Network.
PI Network’s Current Market Standing: A Downtrend Under Scrutiny
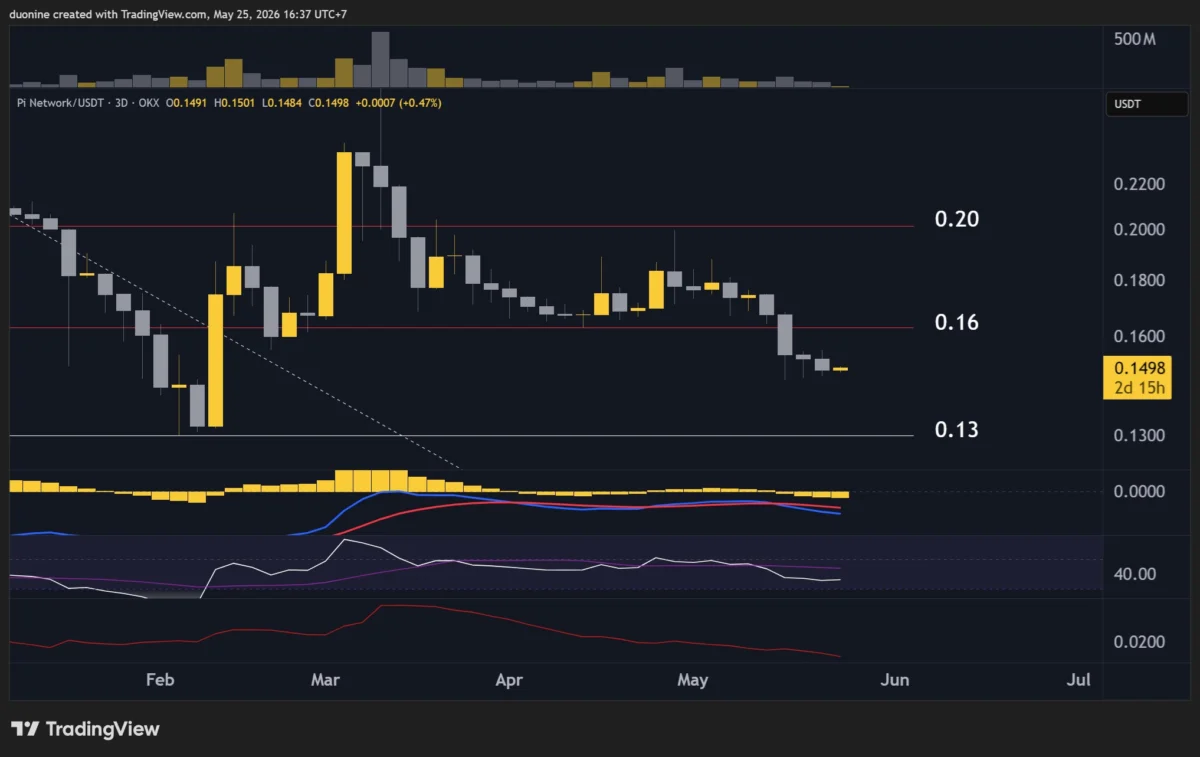
Following a significant breakdown below the $0.16 support level, the price of PI Network experienced a swift decline, eventually finding a temporary floor at $0.15. While this level has attracted some buyer interest, it is premature to declare it a robust support zone. Technical analysts point to a more historically significant level at $0.13, which has previously demonstrated its strength by repelling bearish pressure. The breach of the $0.16 level has effectively handed the initiative back to sellers, raising concerns about a potential resumption of the downtrend. This development is particularly disheartening for PI Network holders, considering the asset has already experienced a substantial correction of approximately 96% from its all-time high, a figure that underscores the severity of its recent market performance.
The chart data, sourced from TradingView, illustrates this price action. The first chart depicts the general price movement, highlighting the struggle around the $0.15 level and the previously established resistance at $0.16. The subsequent price action suggests that the bearish momentum has been significant, pushing the price into uncharted territory relative to recent trading history. The visual representation clearly indicates a period of sustained selling pressure that has characterized PI’s trajectory.
Sellers’ Momentum and the Role of Volume
Despite the sellers regaining control of the market narrative, their current trading volume remains conspicuously low. Furthermore, the price action on decreasing sell volume, often manifesting as lower highs in their attempts to push the price down, suggests a potential lack of conviction or waning interest from bearish participants. This observation is crucial as it could indicate that sellers are not aggressively pursuing further price depreciation.

If the support at $0.15 proves to be resilient, it could provide a foundation for buyers to attempt a recovery. A successful reclaim of the $0.16 level would be a significant psychological victory and could pave the way for PI to regain momentum. Such a reversal would be aimed at clawing back some of the recent losses incurred since the market sentiment turned decidedly bearish for the token. The subsequent chart, also from TradingView, provides a closer look at the trading volume associated with these price movements, visually demonstrating the low sell volume even as the price dips.
Technical Indicators: MACD Signals Potential Divergence
Examining the Moving Average Convergence Divergence (MACD) indicator on a 3-day chart offers another layer of insight into PI Network’s market dynamics. The MACD histogram continues its descent, reaching new lows, which is typically interpreted as a bearish signal. However, this bearish trend is occurring concurrently with decreasing sell volume. This confluence of factors could potentially signal a bullish divergence. A bullish divergence occurs when an asset’s price makes new lows, but a momentum indicator like the MACD makes higher lows, suggesting that the underlying selling pressure is weakening.
The implications of this potential bullish divergence are significant. If the MACD histogram stabilizes or begins to flatten in the upcoming trading sessions, it would represent the first concrete indication that sellers are losing their grip on the price. This shift could precede a "relief rally," a period of upward price movement often seen after a sustained downtrend as short-term traders and opportunistic buyers enter the market. The third chart, displaying the MACD alongside the price, visually represents this ongoing trend and the potential for divergence.
Key Support and Resistance Levels to Watch
For investors and traders monitoring PI Network, several key levels are critical for determining future price direction:
-
Key Support Levels:
- $0.15: The current level where tentative buying interest has emerged. A hold here is crucial for short-term stability.
- $0.13: A historically stronger support level that has previously acted as a floor for the price. A sustained breach of this level would likely lead to further significant declines.
-
Key Resistance Levels:
- $0.16: The immediate resistance level that PI failed to hold. A successful re-test and break above this level would signal a potential shift in momentum.
- $0.20: A more substantial resistance level that, if overcome, could indicate a more robust recovery.
Broader Market Context and PI Network’s Unique Position
The price action of PI Network unfolds against the backdrop of a broader cryptocurrency market that has experienced significant fluctuations. While Bitcoin and Ethereum have also faced their share of volatility, many altcoins have seen even more pronounced swings. PI Network’s journey is somewhat unique due to its development model, which has historically relied on a mobile-first mining approach, with the token not yet widely listed on major exchanges for direct trading. This limited accessibility and the associated speculative nature of its current valuation contribute to its price sensitivity.
The "all-time high" mentioned in the analysis likely refers to an informal valuation or a peak during a period of intense speculation before widespread public trading commenced. The subsequent 96% correction from this peak highlights the speculative premium that has since evaporated, leaving the token to be evaluated more on its perceived future utility and market adoption.
Implications for Investors and the Future of PI Network
The current technical indicators suggest a precarious situation for PI Network. While the immediate support at $0.15 offers a glimmer of hope, the historical significance of the $0.13 level cannot be overlooked. The low selling volume, coupled with the potential bullish divergence on the MACD, presents a scenario where a short-term recovery is plausible, contingent on the $0.15 support holding firm.
However, the overarching downtrend remains a significant concern. Sellers have demonstrated the ability to push the price lower, and any sustained recovery would require a decisive break above key resistance levels, particularly $0.16 and subsequently $0.20. The lack of strong conviction from sellers, as evidenced by low volume, could be interpreted as a sign that the most aggressive selling pressure may have subsided.
The future trajectory of PI Network will likely depend on several factors:
- Market Sentiment: General sentiment in the broader cryptocurrency market will inevitably influence PI’s price.
- Development Progress: Any significant updates or advancements in the PI Network ecosystem could positively impact investor confidence.
- Exchange Listings: Increased accessibility through listings on major cryptocurrency exchanges could lead to greater liquidity and potentially higher valuations.
- Community Engagement: The continued engagement and belief of the PI Network community will play a vital role in supporting the token’s development and potential future success.
For investors, the current juncture presents a high-risk, potentially high-reward scenario. The significant correction means that any future upside could be substantial if the project gains traction. However, the risk of further downside remains, especially if the $0.13 support level fails to hold. Diligent research, a clear understanding of risk tolerance, and a close watch on the aforementioned key technical levels and market developments are essential for anyone considering an investment in PI Network. The coming trading sessions will be critical in determining whether PI can arrest its downtrend and begin a sustainable recovery or if further declines are on the horizon.