

This Friday, we delve into the intricate price action of five prominent cryptocurrencies: Ethereum (ETH), Ripple (XRP), Cardano (ADA), Binance Coin (BNB), and Hyperliquid (HYPE), each exhibiting distinct technical trends and market sentiment. The cryptocurrency landscape continues to be a dynamic arena, with investor confidence and market forces constantly reshaping the value of digital assets. Analyzing these specific movements offers a snapshot of broader trends and potential future trajectories within the decentralized finance (DeFi) ecosystem.
Ethereum (ETH): Navigating the $1,800 Support Level Amidst Seller Pressure
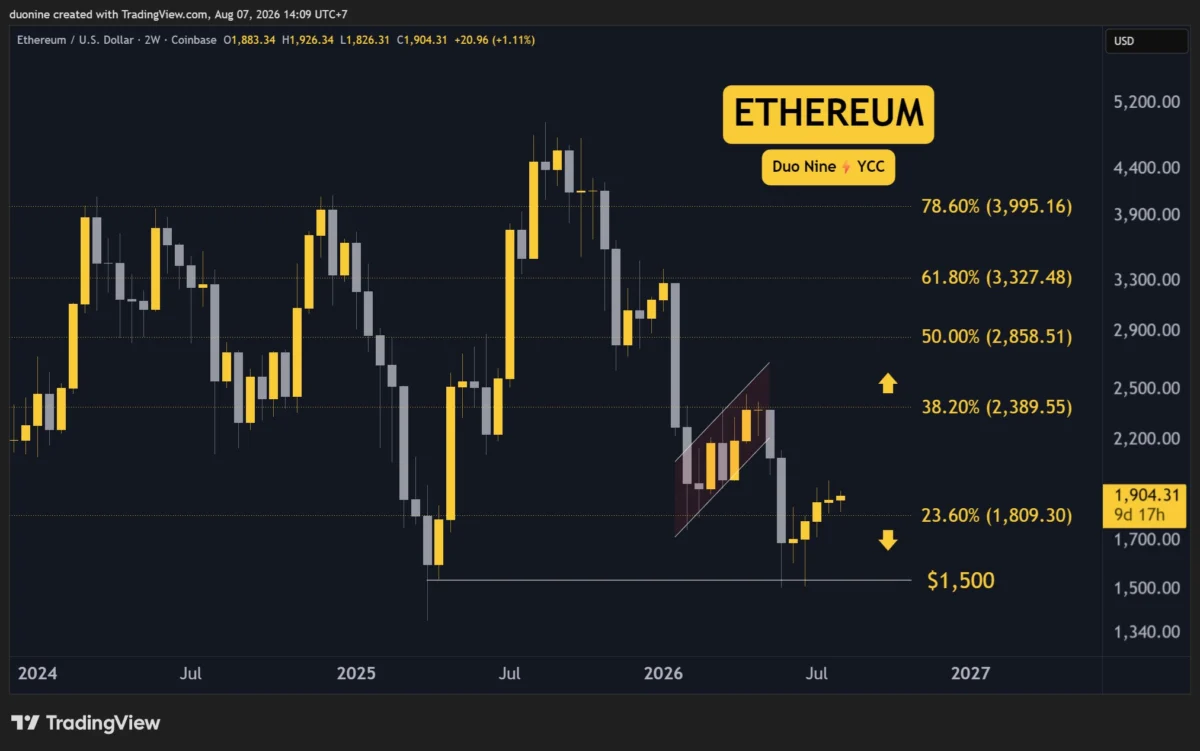
Ethereum, the second-largest cryptocurrency by market capitalization, has been treading water this week, clinging to the critical support level at $1,800. The digital asset has experienced a minor loss of approximately 2% over the past seven days. While this current price action suggests a more favorable position for sellers, they will need to decisively breach this support zone to truly seize the initiative and drive prices lower.
The prevailing technical indicators for ETH reveal a notable degree of weakness following the formation of a lower high just below the $2,000 mark. This indicates that buyers were unable to establish and maintain the $2,000 level as a solid support base, leading to the resurgence of bearish sentiment and selling pressure. This inability to recapture higher ground often signals a potential shift in momentum, where bears can exploit the lack of sustained buying interest.
Looking ahead, the immediate outlook for Ethereum suggests a high probability of retesting the $1,800 support level. Should this crucial psychological and technical barrier fail to hold, the cryptocurrency could find itself revisiting the $1,500 support zone. This level previously acted as a significant floor for buyers in early July, suggesting that a substantial influx of demand emerged around that price point. A breach of $1,500 would signal a more pronounced bearish trend, potentially triggering further price depreciation.
Supporting Data and Context: Ethereum’s price performance is often influenced by broader macroeconomic factors, regulatory developments, and the ongoing evolution of its own ecosystem, particularly the continued adoption and development of decentralized applications (dApps) built on its blockchain. The recent performance, characterized by a struggle to break through key resistance levels and a test of support, is a common pattern in volatile markets where market participants assess the strength of underlying trends. The narrative surrounding Ethereum often revolves around its transition to Proof-of-Stake (PoS) with the Merge, which has been largely successful, and its ongoing upgrades aimed at improving scalability and reducing transaction fees, such as the upcoming "Dencun" upgrade. However, even with these fundamental advancements, short-term price action is heavily dictated by technical analysis and overall market sentiment.
Ripple (XRP): The $1 Mark as a Critical Juncture in a Prolonged Downtrend
Ripple’s XRP has faced a challenging trading week, struggling to maintain its position above the psychologically significant $1 threshold. The digital asset has seen a decline of nearly 3%, bringing it precariously close to turning the $1 level into a key resistance. A further push by sellers could solidify this transition, marking a potentially bearish development for XRP.
If $1 indeed solidifies as resistance, it would likely prolong the existing downtrend that commenced in August 2025. This level is not only a major psychological barrier but also a significant technical point. Any sustained loss of support at $1 could prove costly for bulls, leading to a significant retreat in price. The next critical support level identified by market analysts stands at $0.80, suggesting that a failure to hold $1 could initiate a rapid descent towards this lower price point.
The technical outlook for XRP indicates a low probability of a reversal in its current downtrend, particularly following the price’s descent from two identical pennant formations. These formations are often interpreted as continuation patterns, and their breakdown suggests that bearish forces have maintained strong control over the price action. This reinforces the notion that sellers are in a dominant position.
Supporting Data and Context: Ripple’s price trajectory has been significantly impacted by the ongoing legal battle between its associated company, Ripple Labs, and the U.S. Securities and Exchange Commission (SEC). The SEC’s lawsuit, alleging that XRP is an unregistered security, has created a cloud of uncertainty over the token’s future in the United States. While there have been some favorable rulings for Ripple in specific aspects of the case, the overall legal uncertainty continues to weigh on investor sentiment and market performance. The price action around the $1 mark is particularly sensitive given its historical significance and its connection to the ongoing legal narrative. A decisive break below this level could be interpreted by the market as a negative development in the legal proceedings, or simply a reflection of broader market weakness, exacerbating the existing downtrend.
Cardano (ADA): Testing Support Amidst a Broader Market Correction
Cardano (ADA) began the month on a positive note, but recent market dynamics have seen sellers re-emerge, pushing the price down by approximately 10% this week alone. This corrective move is unwelcome news for bullish investors, who may have already retreated to the key support level situated at 15 cents ($0.15).
Should this corrective phase persist, a re-test of the $0.15 support level appears highly probable. The ability of this level to hold is crucial for ADA if it aims to avoid forming new lows. Any significant weakness or breakdown at this support could lead to a rapid and substantial decline in price, indicating a loss of buyer conviction.
Looking ahead, there is a possibility that Cardano could enter a period of consolidation above the key support level if buyers manage to stabilize the price in this area. Such a consolidation phase could be viewed as healthy, offering a pause after a prolonged downtrend that began in 2025. Consolidation patterns can sometimes precede a renewed upward movement, but only if the underlying support holds firm and buyer interest returns.
Supporting Data and Context: Cardano, known for its research-driven approach to development and its focus on a peer-reviewed blockchain architecture, has experienced its own set of developmental milestones and market fluctuations. The platform has seen the implementation of various upgrades, including the Alonzo hard fork which enabled smart contract functionality. However, like many altcoins, ADA’s price is susceptible to the broader cryptocurrency market sentiment and Bitcoin’s performance. The recent 10% drop suggests that investors are either taking profits after an earlier rally or are de-risking their portfolios in anticipation of further market downturns. The $0.15 level represents a significant price point that has acted as support previously, making its defense critical for maintaining any semblance of bullish momentum. A sustained break below this level could signal a capitulation event for ADA holders.
Binance Coin (BNB): Confirming Support and Eyeing Resistance in a Positive Trend
Binance Coin (BNB) closed the past week on a stronger note, finishing approximately 3% higher after successfully confirming support at the $580 level. This development presents a positive outlook for BNB, suggesting that if sellers do not re-enter the market aggressively at this juncture, the cryptocurrency has a good chance of continuing its upward trajectory towards the key resistance level at $690.
At the time of reporting, BNB is trading around the $610 mark. As long as the price remains above the $600 psychological and technical level, buyers are expected to maintain an advantage in terms of momentum. However, it is noteworthy that the buy volume accompanying this upward movement has remained relatively low, which could indicate a lack of strong conviction from a broad base of investors.
Looking ahead, the technical chart patterns suggest that BNB could be forming a large rounded bottom pattern around its current trading levels. This pattern is generally considered bullish, signaling a potential reversal from a downtrend or consolidation phase into an uptrend. Confirmation of this pattern would be strengthened if the price moves decisively above the $630 level. If this bullish scenario materializes, a test of the $690 resistance becomes a more probable outcome in the near to medium term.
Supporting Data and Context: Binance Coin is intrinsically linked to the Binance ecosystem, the world’s largest cryptocurrency exchange by trading volume. Its utility extends to discounted trading fees on the platform, participation in token sales via Binance Launchpad, and its role within the BNB Chain (formerly Binance Smart Chain), a popular blockchain for decentralized applications and DeFi. The recent positive price action for BNB, despite some broader market headwinds, can be attributed to the continued strength and adoption of the Binance ecosystem and the BNB Chain. The confirmation of support at $580 is a significant technical indicator, suggesting that buyers have stepped in to absorb selling pressure. The potential for a rounded bottom pattern, if confirmed, could signal a sustained recovery for BNB, driven by both its utility and broader market appetite for digital assets. However, the low buy volume remains a point of caution, implying that the current rally might be driven by a smaller group of participants and could be vulnerable to a sharp reversal if sentiment shifts.
Hyperliquid (HYPE): Facing Resistance and the Prospect of Retesting Support
Hyperliquid (HYPE), a lesser-known cryptocurrency in comparison to the others discussed, has experienced a flat performance on the weekly timeframe. The digital asset was met with resistance at the $58 level, indicating a ceiling that has temporarily halted its upward progress. If current market conditions and price action remain unchanged in the coming days, HYPE could find itself revisiting the key support level located at $52.
Since reaching its all-time high of $76 in June, HYPE has been exhibiting a pattern of lower lows and lower highs. This technical characteristic is generally considered bearish, suggesting a persistent downward trend. Given the significant rally experienced in the earlier part of the year, the current correction phase could potentially extend for a considerable period, as market participants digest recent gains and reassess the asset’s value.
Looking ahead, the $52 level stands out as the most decisive point on HYPE’s chart. This key support has, thus far, prevented sellers from pushing the price to new lows. However, the possibility of this level being retested again in the near future exists, which could be interpreted as a bearish signal by market participants. For investors considering HYPE, a cautious approach and patient observation of price action are recommended, allowing market dynamics to provide clearer signals before making any investment decisions.
Supporting Data and Context: While specific details regarding Hyperliquid’s utility and underlying technology are not provided in the original text, its price action suggests it is subject to the same market forces as other cryptocurrencies. The rejection at $58 resistance and the potential retest of $52 support are classic technical indicators of a market in a corrective phase. The formation of lower highs and lower lows since its all-time high is a strong bearish signal that indicates selling pressure is outweighing buying pressure. This pattern suggests that the market may be overvalued at higher levels, or that broader market sentiment has turned negative for this particular asset. The importance of the $52 support level cannot be overstated; a breach of this level would likely lead to further significant price declines, while a successful defense could pave the way for a potential recovery, albeit likely a gradual one.
Broader Implications and Market Outlook
The diverse price movements observed across Ethereum, Ripple, Cardano, Binance Coin, and Hyperliquid highlight the fragmented nature of the current cryptocurrency market. While some assets, like Binance Coin, show signs of building bullish momentum, others, such as Ripple and Cardano, are grappling with significant headwinds, both technical and fundamental. Ethereum’s position at a critical support level underscores the broader market’s indecision, with investors awaiting a clear catalyst to drive prices in either direction.
The ongoing regulatory scrutiny, particularly surrounding assets like XRP, continues to cast a shadow over the broader crypto market. Investors remain keenly aware of potential policy changes and legal rulings that could significantly impact asset valuations. Furthermore, macroeconomic factors, including inflation rates, interest rate policies of central banks, and global economic stability, continue to play a crucial role in shaping investor appetite for riskier assets like cryptocurrencies.
For traders and investors, the current market environment necessitates a thorough understanding of both technical indicators and the underlying fundamental drivers of each cryptocurrency. The ability to identify key support and resistance levels, recognize chart patterns, and stay informed about project developments and regulatory news is paramount. As the market navigates these complex dynamics, patience, strategic planning, and a disciplined approach to investment will be crucial for success in the volatile world of digital assets. The coming weeks will likely provide further clarity on the short-term trajectory of these cryptocurrencies, offering valuable insights into the evolving landscape of the digital economy.
Disclaimer: The information provided in this article is for informational purposes only and does not constitute financial advice. Investing in cryptocurrencies involves significant risk, and readers are advised to conduct their own thorough research and consult with a qualified financial advisor before making any investment decisions. Past performance is not indicative of future results.