The cryptocurrency market, known for its inherent volatility, continues to present a dynamic landscape for investors and enthusiasts alike. In recent weeks, the price action of PI Network’s native token, PI, has been characterized by a persistent correction, sparking discussions about its future trajectory. While the asset has experienced a significant downturn, its current sideways movement around the $0.18 mark has raised concerns among market observers. This analysis delves into the technical indicators and market sentiment surrounding PI, aiming to provide a comprehensive outlook on its potential price movements in the near future.
PI Network’s Recent Price Correction and Current Stagnation
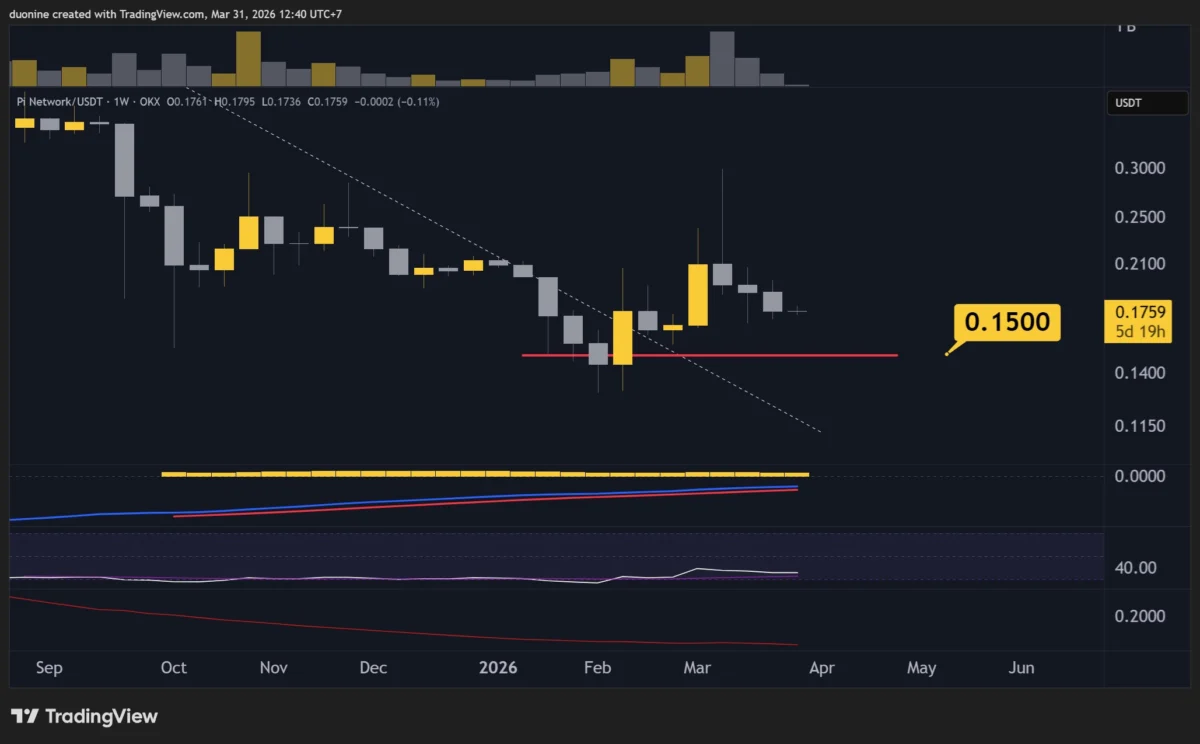
PI Network’s price has seen a substantial decline, shedding approximately 40% from its recent peak of $0.30 to a low of $0.17. This significant correction, while substantial by many metrics, has been followed by a period of consolidation. For the past week, PI has been trading within a narrow range, hovering around the $0.18 level. This prolonged period of sideways trading, often referred to as consolidation or a "sideways market," can be a critical juncture for any asset.
From a technical analysis perspective, such periods can be interpreted in various ways. On one hand, it might indicate a pause in the selling pressure, allowing buyers to potentially regroup and initiate a recovery. On the other hand, prolonged stagnation can increase the likelihood of sellers re-emerging, potentially pushing the price to new lows. The longer PI remains trapped in this range, the greater the risk of a bearish continuation.
To break free from this bearish sentiment and signal a potential reversal, PI needs to reclaim key resistance levels. The immediate hurdle lies at $0.20, a level that, if breached convincingly, could pave the way for further upward movement. A sustained push above this threshold would be crucial in shifting the market sentiment from bearish to neutral or even cautiously optimistic. Failure to do so, however, would leave the door open for bears to reassert their dominance and potentially drive the price down towards the next significant support level.
Key Support and Resistance Levels to Watch
In assessing the potential price movements of PI Network, identifying key support and resistance levels is paramount. These levels act as crucial benchmarks for traders and analysts, offering insights into areas where buying or selling pressure is likely to intensify.
Key Support Levels:
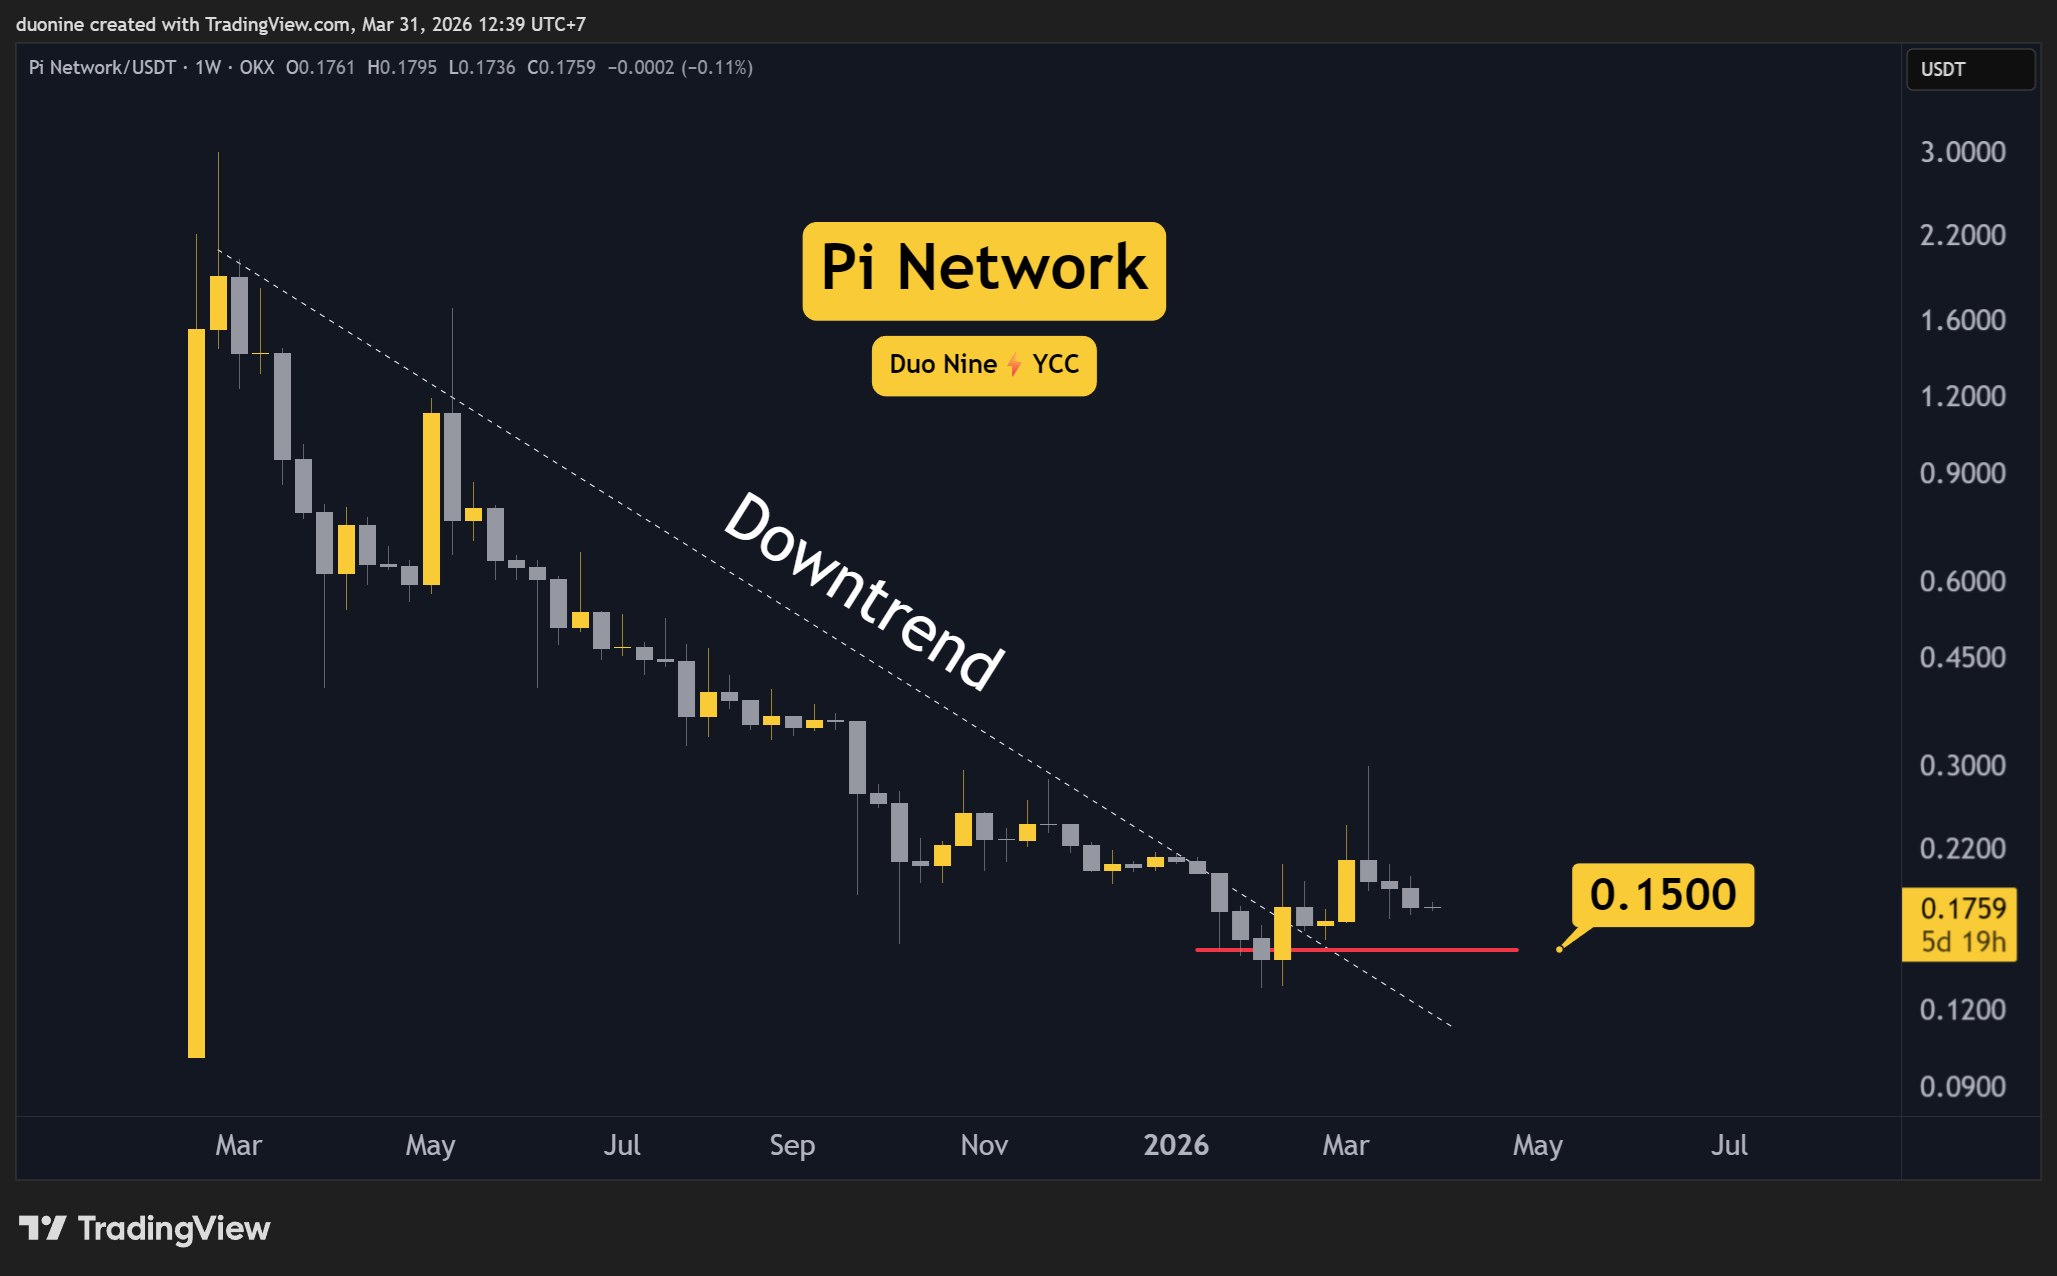
- $0.15: This level represents a significant area of demand. Historically, a break below this point could signal a continuation of the broader downtrend. It also coincides with a notable breakout level from a major downtrend that began in 2025, making its defense critical for any bullish recovery.
Key Resistance Levels:
- $0.20: This is the immediate resistance level that PI needs to overcome to signal a potential shift in momentum. A successful breach of this level would be a positive sign for buyers.
- $0.28: This is a more significant resistance zone. Surpassing this level would indicate a stronger recovery and could suggest the potential for PI to challenge higher price points.
The interplay between these levels will be crucial in determining the short-to-medium-term outlook for PI. A sustained break above resistance levels, coupled with increased trading volume, would typically be interpreted as a bullish signal, while rejections at these levels could reinforce the bearish trend.
The Vanishing Volume: A Double-Edged Sword
One of the more encouraging signs amidst PI’s price consolidation is the significant decrease in trading volume. This reduction in activity can be interpreted in several ways. It suggests that the aggressive selling that characterized the initial correction has subsided. Sellers may have either exhausted their supply or are now more hesitant to offload their holdings at current prices, perhaps anticipating a potential rebound.
This decline in selling pressure has provided PI with the breathing room to move sideways. However, this is not necessarily a bullish indicator in isolation. Low volume can also signify a lack of conviction from both buyers and sellers. If buyers do not return with significant force to drive the price upwards, the market could remain in a state of indecision.
The implication of this low volume scenario is that the current equilibrium is fragile. Without renewed buying interest, the path of least resistance could still be downwards. If the price fails to break out of its current range and sellers eventually re-engage, the existing low volume might mean that there isn’t enough buying support to absorb the selling pressure, leading to a sharper decline.
The RSI Indicator: A Bearish Signal Remains
Technical indicators often provide valuable insights into market sentiment and potential future price movements. The Relative Strength Index (RSI), a momentum oscillator used to measure the speed and change of price movements, is currently signaling a bearish bias for PI Network on the daily timeframe.
The daily RSI has been persistently trading below the 50-point mark. In technical analysis, an RSI below 50 is generally considered bearish, indicating that selling pressure outweighs buying pressure. As long as the RSI remains in this territory, it suggests that the momentum is skewed in favor of sellers, and a significant price reversal is unlikely.
While the moving average of the RSI has shown some upward curvature recently, this is not a definitive signal of an impending rally. For a stronger bullish confirmation, the RSI would need to break decisively above the 50-point level and ideally aim for higher highs. The last significant high on the RSI chart, around the 52-point mark, would serve as a critical target. A sustained move above this level would be a more convincing indication that buyers are regaining control and that the bearish momentum is waning. Until such a breakout occurs, the RSI remains a cautionary indicator, reinforcing the notion that the prevailing trend is still bearish.
The Broader Context: PI Network’s Development and Market Perception
Understanding the price action of PI Network requires looking beyond immediate technical indicators and considering the project’s broader development and market perception. PI Network aims to create a cryptocurrency that can be mined on mobile devices, with the goal of fostering widespread adoption and accessibility. The project has been in a development phase for an extended period, with its mainnet operating in an enclosed mode for a significant duration.
This extended development phase, while allowing for robust testing and ecosystem building, has also contributed to uncertainty regarding its full market integration and official listing on major cryptocurrency exchanges. The lack of a fully open mainnet and widespread tradability has limited the direct price discovery mechanisms typically seen in the crypto market.
The current price levels, often observed on over-the-counter (OTC) markets or specific trading platforms, may not fully reflect the potential future value of PI once it achieves broader market access. However, the existing price action is still a reflection of the current supply and demand dynamics within the available trading venues.
Potential Future Scenarios for PI Network
Given the current technical indicators and market conditions, several scenarios could unfold for PI Network in the coming days and weeks:
1. Continued Sideways Consolidation: If neither buyers nor sellers gain significant traction, PI could remain in its current trading range for an extended period. This scenario would prolong the uncertainty and could lead to increased volatility once a breakout eventually occurs. The risk here remains a gradual slide downwards due to a lack of sustained buying interest.
2. Bearish Breakdown: The most immediate concern is a potential breakdown below the $0.15 support level. This would confirm the continuation of the downtrend and could lead to further price depreciation. Such a move would likely be triggered by a resurgence of selling pressure, possibly exacerbated by negative market news or a lack of positive developments from the PI Network project itself.
3. Bullish Reversal: For a bullish reversal to materialize, PI needs to break convincingly above the $0.20 resistance level. This would require a significant influx of buying volume and a shift in market sentiment. A successful retest and hold of the $0.20 level as support would be a crucial step in confirming a potential recovery. Further upside could then target the $0.28 resistance. This scenario would likely be fueled by positive project updates, such as advancements in mainnet development, increased utility for PI tokens within its ecosystem, or successful integration with major trading platforms.
Conclusion and Investor Outlook
The ongoing correction and subsequent sideways movement of PI Network’s price present a critical juncture for the asset. While the decline from $0.30 to $0.17 represents a significant drawdown, the current lack of upward momentum around $0.18 is a cause for concern. The dwindling trading volume, while indicating reduced selling pressure, also points to a potential lack of strong buying conviction.
The bearish signal from the daily RSI, remaining below 50, further reinforces the cautious outlook. For any significant bullish reversal to occur, PI must first reclaim the $0.20 resistance level and demonstrate sustained buying pressure. The $0.15 support level remains a crucial line in the sand, with a breach potentially leading to further declines.
Investors and observers of PI Network will be closely monitoring the $0.20 and $0.15 levels as key indicators of future price direction. The market’s response to these levels, coupled with any forthcoming developments from the PI Network project, will ultimately dictate whether the current correction continues or if a sustained recovery can begin. The path forward for PI hinges on its ability to attract renewed buying interest and overcome the lingering bearish sentiment in the market.