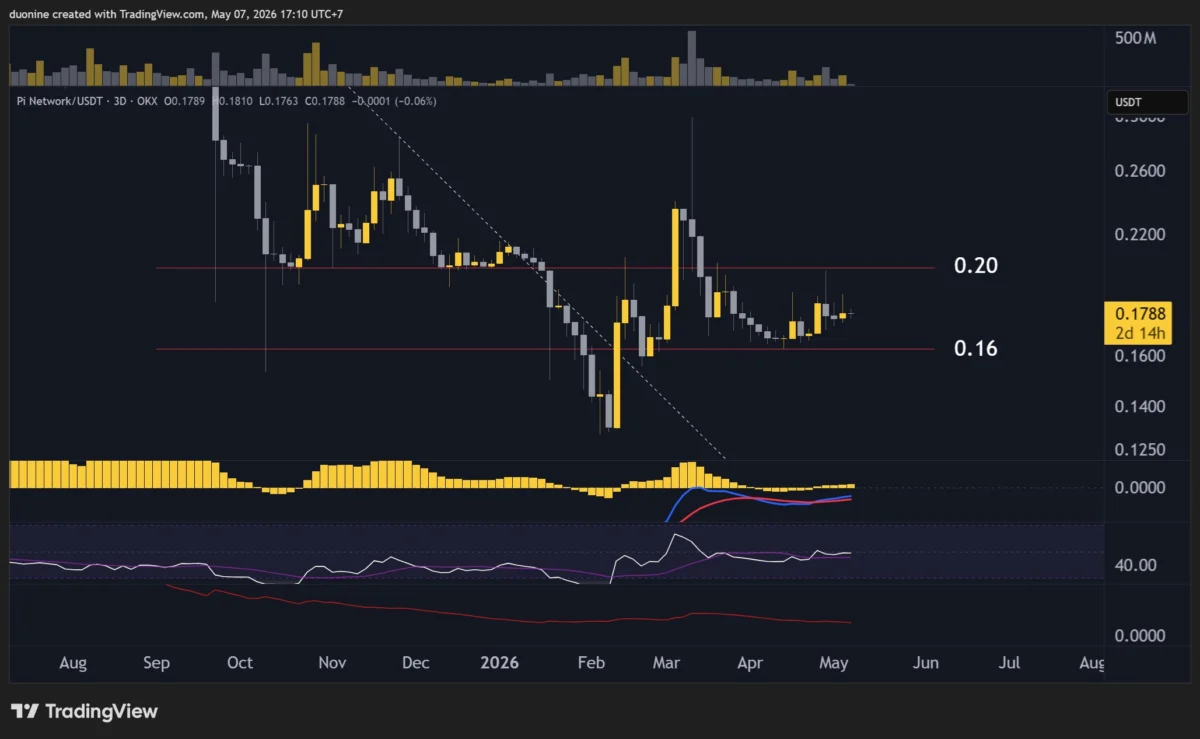
The digital currency market has witnessed a period of consolidation for PI Network (PI), with its price currently trading within a well-defined horizontal channel. This sideways movement, characterized by consistent bounces between support and resistance levels, suggests a period of indecision among market participants. Analysts are closely observing these patterns for signs of a potential breakout, which could dictate the asset’s future trajectory.
PI Network Stuck in a Price Channel
Since hitting a low of approximately $0.13, PI Network’s price has established a trading range between $0.16 and $0.20. This price band has acted as a significant floor and ceiling since early March, with multiple attempts to break free being met with resistance or a swift reversal. The sustained nature of this consolidation indicates a delicate balance of buying and selling pressure.
A notable instance of this price action occurred in late April. Buyers attempted to push PI above the $0.20 resistance level, showing initial bullish intent. However, this upward momentum was short-lived. The buying pressure was quickly overwhelmed by a surge in selling volume on two separate occasions, effectively capping the rally and forcing the price back towards the $0.16 support level. This pattern of failed breakouts has reinforced the boundaries of the current trading channel.
The persistent trading within this narrow range suggests that neither buyers nor sellers have gained a decisive advantage. Investors are likely awaiting a catalyst, either positive or negative, to trigger a significant price movement. The current equilibrium could be interpreted as a period of accumulation for some, while others might be taking profits or exiting positions due to the lack of upward momentum.
Momentum Indicators Signal Indecision
The underlying momentum of PI Network’s price has mirrored its sideways trading pattern, exhibiting a flat trajectory without a clear directional bias since March. This observation is further supported by the behavior of key momentum indicators, which have been oscillating around their mid-range values. This lack of strong directional signal from these indicators suggests that market sentiment is currently neutral.

Despite the consolidation, there were periods of increased trading volume observed in late April and throughout May. While these volume surges indicate heightened activity, they were ultimately insufficient to propel PI beyond the $0.20 resistance. This suggests that the buying pressure, though present, was not strong enough to overcome the selling pressure at that key price point.
However, the recurring attempts to breach the $0.20 mark, even if unsuccessful thus far, should not be entirely dismissed. A sustained and decisive push above this resistance, potentially fueled by renewed market interest or positive project developments, could indeed lead to a breakout. In such a bullish scenario, traders and analysts would then turn their attention to the next significant resistance level, projected to be around $0.28. This potential upward move would signify a shift in market sentiment from consolidation to a clear uptrend.
The Role of the Relative Strength Index (RSI)
The daily Relative Strength Index (RSI) for PI Network has been particularly illustrative of the current market sentiment. Over the past week, the RSI has been hovering closely around the midpoint of 50. The RSI is a popular momentum oscillator used to measure the speed and change of price movements. A reading above 70 typically indicates overbought conditions, while a reading below 30 suggests oversold conditions. A reading around 50 signifies a neutral state, where buying and selling pressures are relatively balanced.
This prolonged stay around the 50-point mark on the daily RSI confirms the lack of strong directional momentum. It suggests that PI is currently in a state of equilibrium, neither experiencing significant buying enthusiasm nor widespread selling pressure. This neutral stance has contributed to the price’s sideways movement, consolidating around the $0.18 mark.
For a bullish breakout to gain traction and build confidence among investors, the daily RSI would ideally need to move decisively above the 50-point level and begin an ascent towards the 70-point threshold. Such a movement would signal a resurgence of buying interest and a potential shift towards an overbought condition, which, in this context, would be a positive indicator for a bullish trend. This ascent of the RSI would likely coincide with a renewed attempt to challenge and overcome the critical $0.20 resistance level. The ability of the RSI to sustain a move above 50 would be a crucial confirmation for any potential upward price movement.
Key Support and Resistance Levels to Watch
Technical analysis of PI Network’s price action highlights several key levels that are crucial for understanding potential future movements.
-
Key Support Level: $0.16
This level has proven to be a significant floor for PI’s price. Since early March, the $0.16 mark has acted as a point where buying interest has emerged, preventing further price declines. Any sustained break below this level could signal a bearish trend, opening the door for further price depreciation towards lower, as yet undefined, support zones. However, the repeated rejections of price drops below $0.16 suggest that a considerable number of investors view this price point as attractive for entry. -
Key Resistance Levels: $0.20 and $0.28
The $0.20 level has been a persistent barrier for PI’s upward momentum. As discussed, multiple attempts to break through this resistance have been thwarted by increased selling pressure. Successfully breaching and holding above $0.20 would be a significant technical achievement for the bulls and could pave the way for a move towards the next major resistance.
The $0.28 level represents the next significant target for bulls should a breakout above $0.20 occur. This level has not been tested as recently as $0.20, and its significance would be confirmed by sustained buying pressure following a successful breach of the immediate resistance. Reaching and potentially surpassing $0.28 would indicate a strong bullish sentiment and a potential for further price discovery.
Background and Context of PI Network
PI Network is a project that aims to make cryptocurrency mining accessible to everyday people through mobile devices. Launched in 2019, it operates on a proof-of-stake consensus mechanism and emphasizes community engagement and development. The project’s unique approach to mining, allowing users to "mine" PI coins by simply checking in daily on their mobile app, has garnered a large user base. However, the token has yet to be listed on major cryptocurrency exchanges, and its actual market value and utility are subjects of ongoing discussion and speculation within the crypto community. The current low price of PI is largely attributed to its limited trading availability and the ongoing development and ecosystem building phases. The project’s roadmap includes future plans for utility and broader integration, which are anticipated to influence its long-term valuation.
The project’s development has been characterized by several phases, including the initial mining phase, the development of the Pi blockchain, and the ongoing efforts to build an ecosystem of Pi-based applications and utilities. The community’s anticipation for the mainnet launch and wider exchange listings has been a significant driver of interest, despite the current price stagnation.
Timeline of Recent Price Action
- Early March: PI Network’s price bottomed out around $0.13 and began to consolidate.
- Early March to Present: The price has consistently traded within the $0.16 to $0.20 range.
- Late April: A notable attempt to break above the $0.20 resistance was met with increased selling volume, leading to a price pullback.
- Late April – May: Volume indicators showed increased activity, but this did not translate into a decisive breakout.
- Past Week: The daily RSI has been trading around the 50-point mark, indicating a neutral momentum.
Potential Implications of a Breakout
The current consolidation phase presents two primary scenarios for PI Network: a bullish breakout or a bearish breakdown.
Bullish Scenario:
If PI Network manages to break decisively above the $0.20 resistance, it could trigger a significant upward movement. This breakout would likely be supported by increasing trading volume and a sustained rise in the daily RSI above 50, potentially heading towards 70. The immediate target would be the $0.28 resistance. A successful breach of $0.28 could signal the start of a more substantial uptrend, attracting further investor interest and potentially leading to higher price targets. Such a breakout could be catalyzed by positive developments within the PI ecosystem, such as successful mainnet migration, new partnerships, or increased utility for the PI coin.
Bearish Scenario:
Conversely, if PI Network fails to sustain its price above the $0.16 support level, it could lead to a bearish trend. A breakdown below $0.16, especially with increased selling volume and a falling RSI, would suggest that the bears have taken control. This could result in a price decline towards lower, unestablished support levels. Such a scenario might be triggered by negative news regarding the project’s development, regulatory concerns, or a broader downturn in the cryptocurrency market.
Expert and Community Sentiment (Inferred)
While direct quotes from PI Network representatives or key community figures are not provided in the source material, the observed price action and technical indicators allow for inferred sentiment. The persistent trading within a tight range suggests a cautious approach from market participants. Buyers are willing to step in at $0.16, indicating a belief in the asset’s underlying value or future potential. However, sellers are actively defending the $0.20 level, suggesting a level of profit-taking or skepticism about immediate upward momentum.
The community’s anticipation for key project milestones, such as wider exchange listings and the development of real-world utility for PI, plays a crucial role in shaping sentiment. Positive developments in these areas could act as catalysts for a breakout, while delays or setbacks could lead to increased selling pressure. The current technical stalemate implies that the market is in a holding pattern, awaiting concrete news or a significant shift in overall market conditions.
Conclusion: A Market on Hold
PI Network’s price is currently navigating a period of consolidation, characterized by its confinement within a horizontal channel between $0.16 and $0.20. Momentum indicators, including the RSI, reflect this indecision, hovering around neutral levels. The key to PI’s future price action lies in its ability to decisively break through the $0.20 resistance. A successful breakout, supported by increasing volume and positive RSI movement, could propel the price towards the $0.28 level and beyond. Conversely, a failure to maintain the $0.16 support could signal a bearish turn. Investors and enthusiasts are keenly watching for the catalyst that will determine whether PI Network will ascend to new heights or remain within its current trading range. The project’s underlying development and ecosystem growth will undoubtedly play a pivotal role in shaping these future price movements.