

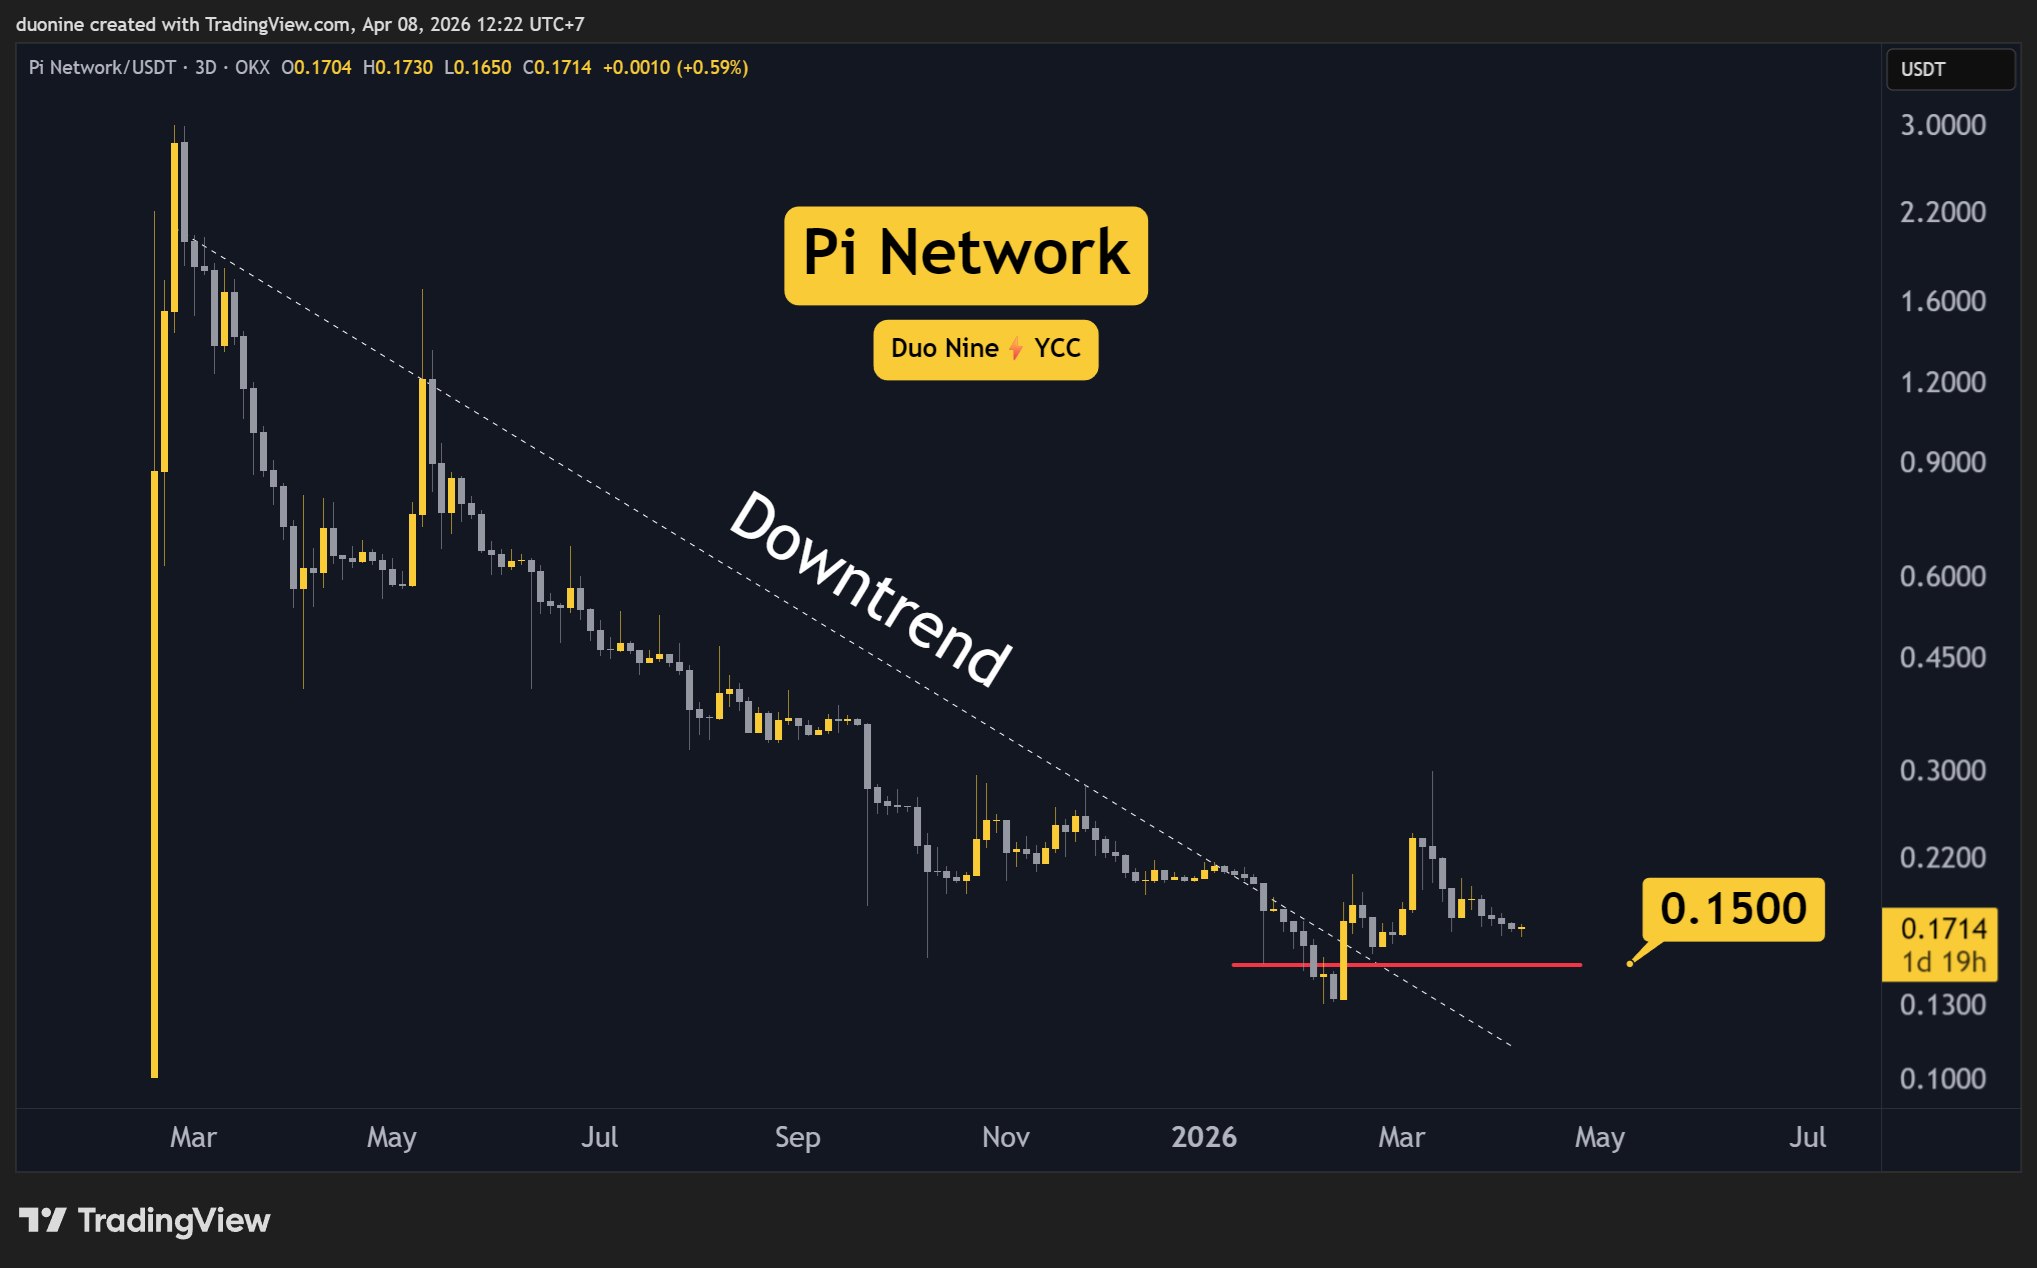
The cryptocurrency market, known for its volatility, is currently observing the price action of the PI Network (PI) token with keen interest. Following a recent correction that saw the token dip from the 30-cent mark, PI has established a significant support zone around the $0.17 level. This area has proven to be a formidable defense against further downward pressure for over two weeks, presenting the first potential bullish signal that a reversal might be on the horizon.
PI Network (PI) Price Predictions: Analysis
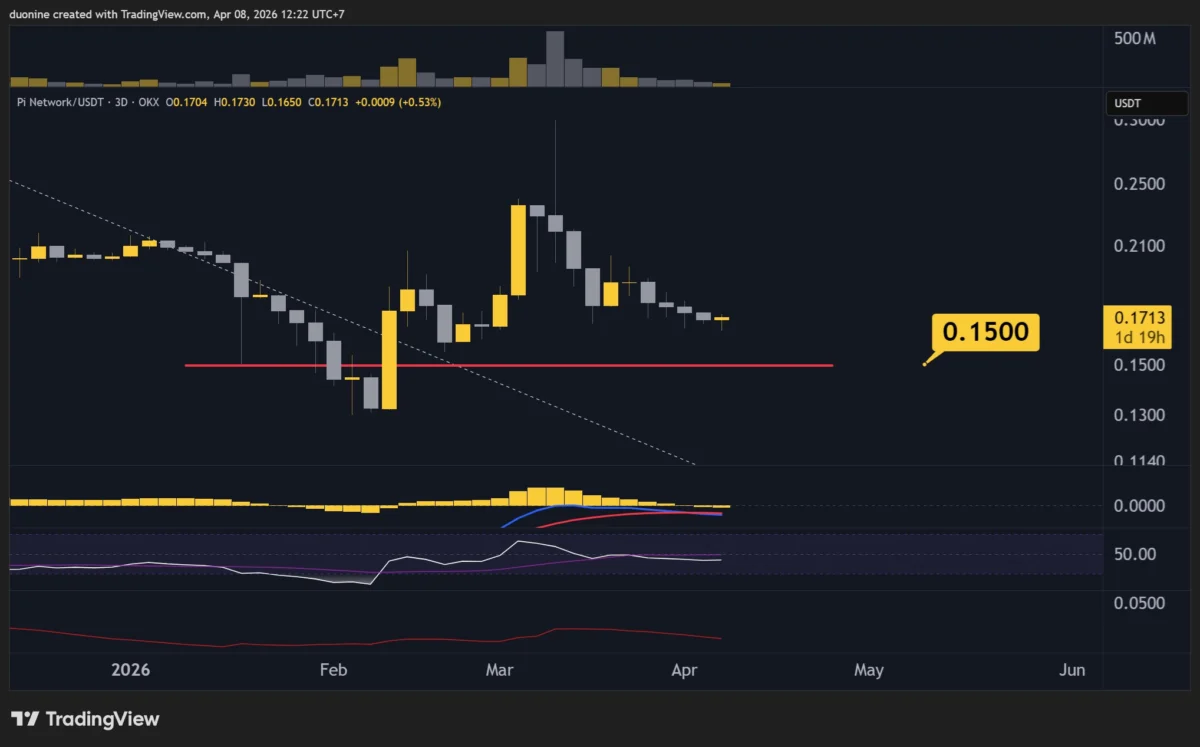
Key support levels for PI are currently identified at $0.15. Conversely, crucial resistance levels to watch are $0.20 and $0.28. The current market sentiment suggests that if PI can maintain its hold above the $0.17 support, a move towards the $0.20 resistance could be imminent.
PI Holds at Key Support, Suggesting Buyer Interest
The sustained defense of the $0.17 area by PI buyers is a noteworthy development. This level has acted as a floor, preventing bears from pushing the price lower for an extended period. This resilience is often interpreted as a sign of accumulating buying pressure, potentially signaling an end to the recent corrective phase. The market is observing a period of low volatility and declining trading volume for PI. This consolidation phase, characterized by reduced price swings and diminishing trading activity, is frequently a precursor to a significant price movement. Technical analysts often interpret this as a period of equilibrium before a decisive breakout or breakdown. In the context of PI, this lull could present a strategic opportunity for buyers to assert dominance and attempt to retest the initial resistance level at $0.20. The chart data, as visualized on TradingView, supports this observation of price compression.
Momentum Reversing: RSI Indicators Signal Potential Shift
Further analysis of PI’s price action on the daily timeframe reveals encouraging signs from the Relative Strength Index (RSI) indicator. The RSI is exhibiting a pattern of higher lows, a classic bullish divergence that suggests weakening selling pressure and increasing buying momentum. Furthermore, the RSI is closing near the midpoint of 50, a crucial psychological and technical level. When the RSI hovers around 50 and shows higher lows, it often indicates that sellers are becoming exhausted, creating an opening for buyers to step in and drive the price upwards. If PI can successfully hold its ground around current levels, the path towards the $0.20 resistance appears increasingly probable. The inability of sellers to force a breach of the $0.17 support, coupled with the positive RSI trend, points towards a potential shift in market sentiment.
MACD Signals a Potential Bullish Crossover
The Moving Average Convergence Divergence (MACD) indicator on the daily chart also presents a compelling case for a potential bullish reversal. The MACD histogram is showing higher lows, and the moving averages are displaying a noticeable upward curve. A bullish crossover, where the MACD line crosses above the signal line, would confirm this burgeoning bullish sentiment and could signal the start of a sustained upward trend. Historically, a MACD bullish crossover has often preceded significant price rallies in various cryptocurrencies. If this pattern continues to develop, it could propel PI’s price back towards the $0.20 mark, a level that has acted as a significant psychological and technical barrier in recent trading sessions.
Market Dynamics and Investor Sentiment
The recent correction in PI’s price can be attributed to a broader market sentiment shift or specific factors impacting the PI Network ecosystem. While the exact catalysts for the initial decline from the 30-cent level are not explicitly detailed in the provided data, it is common for cryptocurrencies to experience pullbacks after periods of rapid ascent, driven by profit-taking, shifts in investor sentiment, or broader macroeconomic influences.
The PI Network itself has garnered significant attention for its unique approach to cryptocurrency mining through mobile devices, aiming to make cryptocurrency accessible to a wider audience. The project’s development roadmap, community engagement, and upcoming milestones often play a crucial role in influencing investor confidence and, consequently, its token price.
Chronology of Recent Price Action
- Recent Past: PI experienced a significant correction from the 30-cent level.
- Last Two Weeks: The token found strong support around the $0.17 area, where it has been consolidating. This period of consolidation has been marked by low volatility and falling trading volumes.
- Current Observation: Technical indicators such as the RSI and MACD on the daily timeframe are suggesting a potential reversal of momentum, with signs of buyer interest and seller exhaustion.
Key Resistance Levels and Potential Targets
The immediate target for PI buyers, should the upward momentum materialize, is the $0.20 resistance level. A successful breach of this level could pave the way for further upward movement, with the next significant resistance identified at $0.28. Achieving these targets would signify a strong recovery from the recent correction and a reassertion of bullish control in the market.
Broader Market Implications and Investor Strategy
The current price action of PI Network presents a classic scenario of potential consolidation before a breakout. For investors and traders, this period calls for a cautious yet observant approach. The confirmation of a bullish MACD crossover and a sustained break above the $0.20 resistance would be strong indicators for a potential upward trend. Conversely, a failure to hold the $0.17 support could lead to further downside pressure, with the $0.15 level becoming the next critical area of interest.
The fact that PI has held a key support level for an extended period, coupled with positive signals from momentum indicators like the RSI and MACD, suggests that the correction phase might indeed be nearing its end. The coming days and weeks will be critical in determining whether buyers can fully regain control and push the PI token towards its next significant resistance levels. Patience and careful monitoring of price action and indicator developments will be paramount for those looking to capitalize on any potential upward movement.
Disclaimer: This analysis is based on technical indicators and current price action. The cryptocurrency market is highly speculative, and investors should conduct their own thorough research and consider their risk tolerance before making any investment decisions. Information provided here is for informational purposes only and does not constitute financial advice.