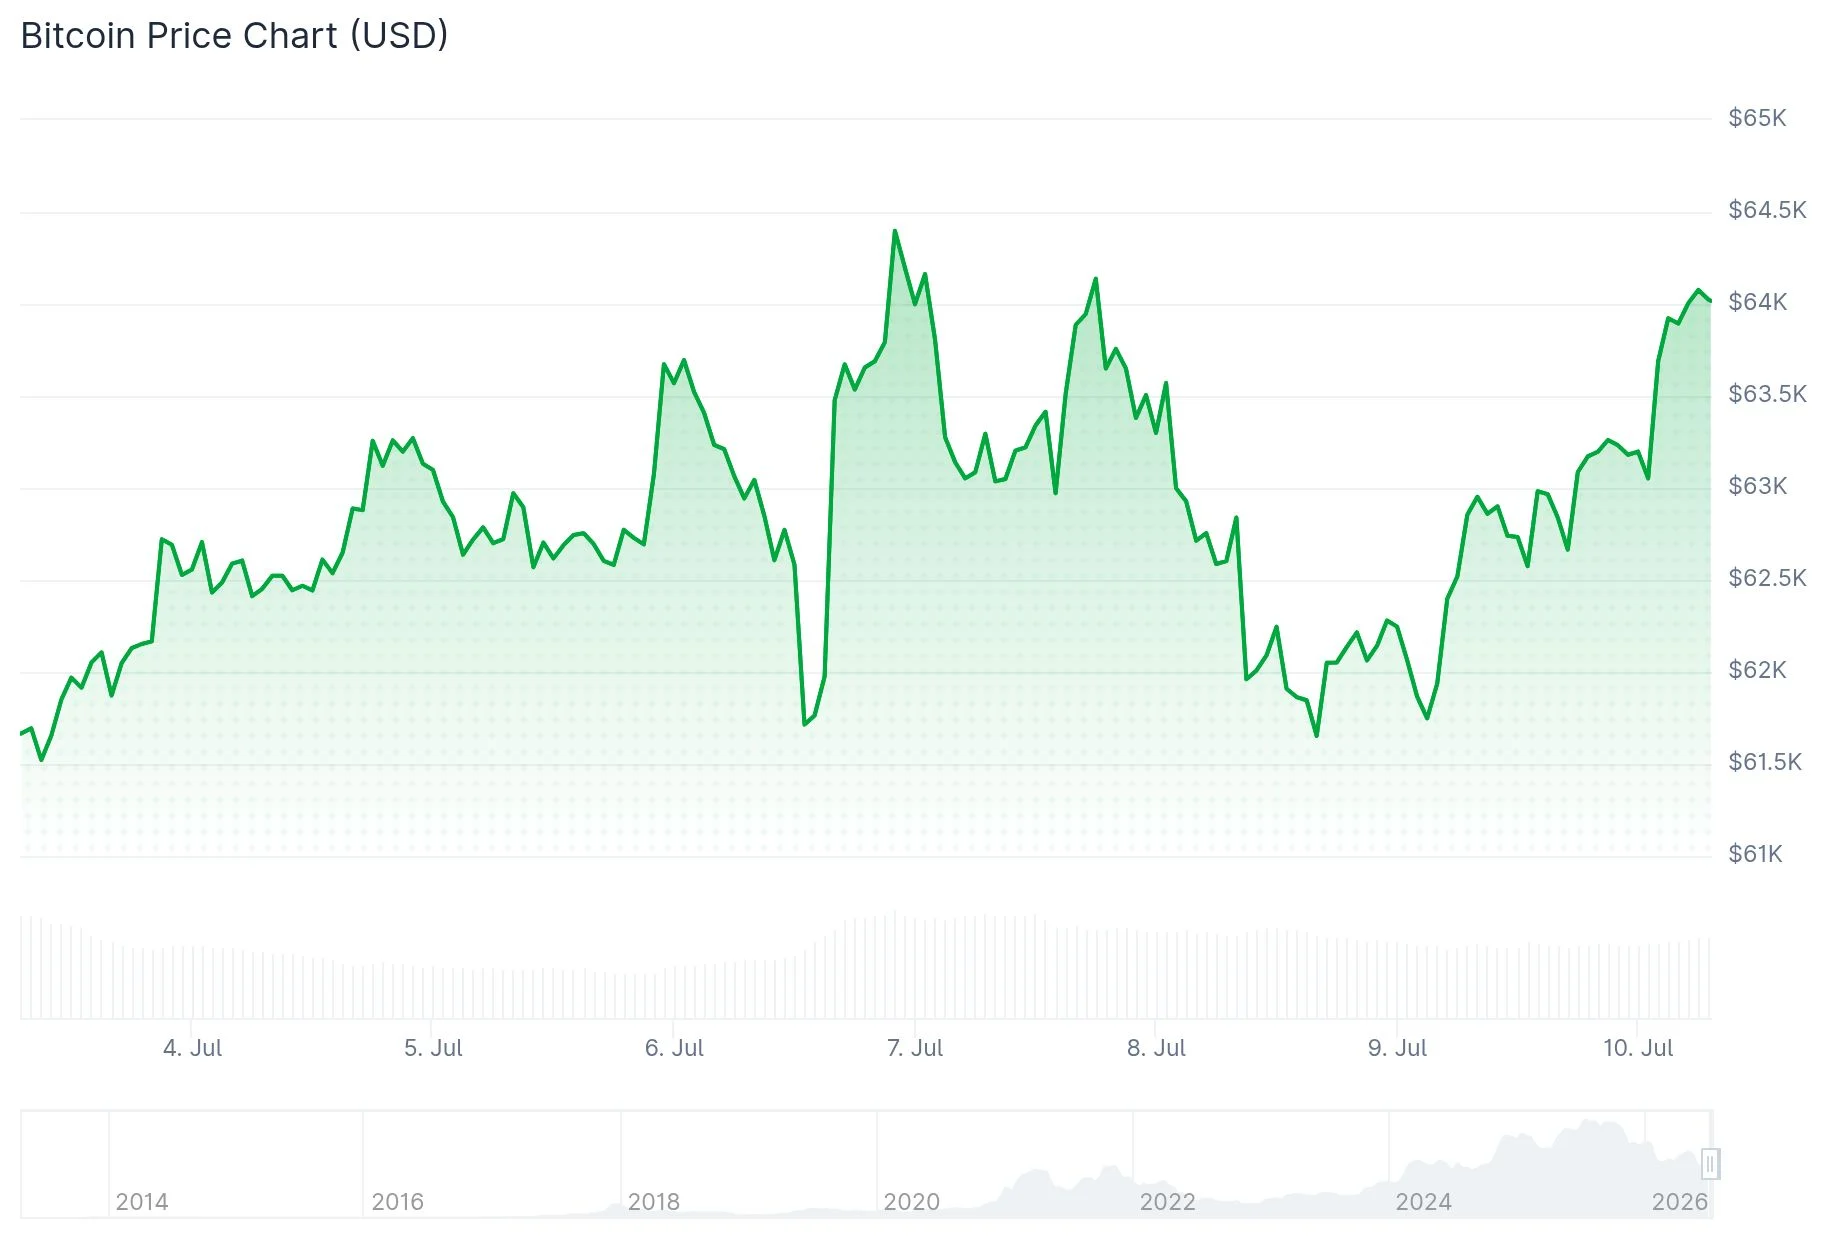
Bitcoin (BTC), the world’s leading cryptocurrency by market capitalization, demonstrated a robust recovery on Thursday, pushing its price back above the crucial $63,000 threshold. The surge, which saw the digital asset post gains of approximately 1.5% during the trading session, was primarily catalyzed by unexpected remarks from US President Donald Trump, signaling a potential shift towards diplomatic engagement with Iran. This development swiftly mitigated concerns that had gripped risk-oriented asset markets just a day prior, following the President’s earlier announcement regarding the termination of a ceasefire with the Middle Eastern nation. The positive sentiment was not confined to the crypto sphere, as broader equity markets in the United States also experienced an upward swing, providing a supportive backdrop for digital asset prices and reversing the previous day’s downturn.
Geopolitical Reversal Spurs Market Rebound
The sudden shift in market sentiment underscores the increasing sensitivity of global financial markets, including the volatile cryptocurrency sector, to geopolitical developments. On Wednesday, the financial world reacted with palpable anxiety when President Trump announced the termination of a previously established ceasefire with Iran. While the precise details of this "ceasefire" were not extensively elaborated in the original reporting, the market’s initial interpretation was one of heightened geopolitical risk, often leading investors to shy away from riskier assets like cryptocurrencies and emerging market equities in favor of safer havens. This apprehension directly contributed to a downturn across digital asset markets, with Bitcoin experiencing a dip below key support levels.
However, the landscape dramatically altered within a mere 24 hours. President Trump’s subsequent indication that Iran was now seeking diplomatic engagement represented a significant de-escalation from the confrontational stance implied by his earlier remarks. Such a pivot towards dialogue, even if tentative, is typically interpreted by financial markets as a reduction in immediate geopolitical risk. This perceived abatement of tension often encourages investors to re-engage with growth-oriented and risk-on assets, leading to capital inflows. The immediate beneficiaries included US equity markets, which mirrored Bitcoin’s upward trajectory, highlighting the interconnectedness of global financial instruments and their collective response to major international political shifts. For Bitcoin, which has increasingly been viewed as a macro asset susceptible to global economic and political currents, this reversal of rhetoric provided a much-needed impetus for recovery.
Massive Short Liquidations Fuel Upward Momentum
The swift turnaround in Bitcoin’s price trajectory caught a significant portion of the market off guard, particularly those who had positioned themselves for further declines. According to data compiled by CoinGlass, a prominent cryptocurrency data analytics platform, liquidations of cryptocurrency short positions approached a staggering $100 million within a 24-hour window.
To understand the significance of this figure, it’s crucial to grasp what a "short position" entails in trading. A trader opens a short position when they anticipate a decrease in an asset’s price. They borrow the asset, sell it, and aim to buy it back at a lower price later, returning the borrowed asset and profiting from the difference. A "liquidation" occurs when the price of the asset moves against the short seller’s prediction to such an extent that their collateral (margin) can no longer cover potential losses. At this point, the exchange automatically closes their position to prevent further losses, often by buying back the asset on the open market.
The near-$100 million in short liquidations signals a "short squeeze." As Bitcoin’s price began to climb following Trump’s remarks, these short positions became unprofitable. Forced buying by exchanges to cover these liquidated positions created additional upward pressure on the price, exacerbating the rally. This phenomenon amplified Bitcoin’s recovery, turning a modest price increase into a more pronounced upward movement as bearish bets were systematically unwound. It underscores the highly leveraged nature of the cryptocurrency derivatives market, where rapid price movements can trigger cascade effects, leading to significant volatility.

Market Analysts Offer Varied Outlooks and Key Price Targets
The sudden rally prompted a flurry of analysis from prominent cryptocurrency traders and market observers, who quickly began to identify critical price levels and potential future trajectories for Bitcoin.
Daan Crypto Trades, a widely followed market analyst, pinpointed $64,700 as a crucial threshold for observation at the daily market close. In a communication via X (formerly Twitter), he articulated, "A daily close above $64,700 flips the story and would make for a larger relief rally across the board." He noted that Bitcoin had been trading within a defined range of $61,300 to $64,700, having spent the morning climbing back up after the previous day’s "risk-off flush." Conversely, Daan Crypto Trades also cautioned that a close beneath $61,300 would "open the road to the lows again and kill the momentum," suggesting a re-evaluation of bullish prospects. This range-bound observation highlights the immediate battle between bullish and bearish forces, with clear lines drawn for market direction.
Another trader, Killa, expressed a decidedly non-bearish stance on the present market structure. Despite the recent volatility, Killa maintained optimism, indicating a target of $68,000 as a prospective entry point for a short position, suggesting an expectation of reaching this level before a potential reversal. This perspective implies an anticipation of further upward movement in the short term, followed by an eventual correction. Killa further anticipated "several additional months of volatile price movement," reflecting the inherent unpredictability and dynamic nature of the cryptocurrency market, where sharp swings are commonplace.
Trader Jelle offered a slightly different perspective, highlighting the $65,000-$70,000 range as the subsequent objective should bullish forces successfully recapture key thresholds. This range represents a significant psychological and technical barrier. Jelle noted that a rejection at these levels might drive BTC back under $60,000, underscoring the importance of these higher resistance points in confirming a sustained upward trend. Failure to break through could signal exhaustion among buyers and pave the way for a retracement.
Market analyst Ted (@TedPillows) brought attention to an interesting on-chain observation, noting "unexpected BTC purchasing activity on Binance," one of the world’s largest cryptocurrency exchanges. This influx of buying pressure on a major platform is often interpreted as a bullish signal, indicating strong institutional or large-scale investor interest. Ted suggested that if Bitcoin successfully reclaims $65,000, a recovery rally targeting $72,000-$74,000 might materialize within a three to four-week timeframe. This forecast provides a medium-term bullish outlook contingent on breaking immediate resistance levels, suggesting that significant capital could be waiting on the sidelines for confirmation of a breakout.
Blockchain Metrics Point Towards Potential Cycle Bottom Formation
Beyond immediate price action and analyst sentiment, underlying blockchain metrics provide a deeper, more fundamental perspective on Bitcoin’s market health and potential future trajectory. Analytics from Glassnode, a leading on-chain intelligence platform, reveal compelling data that often precedes significant market shifts.
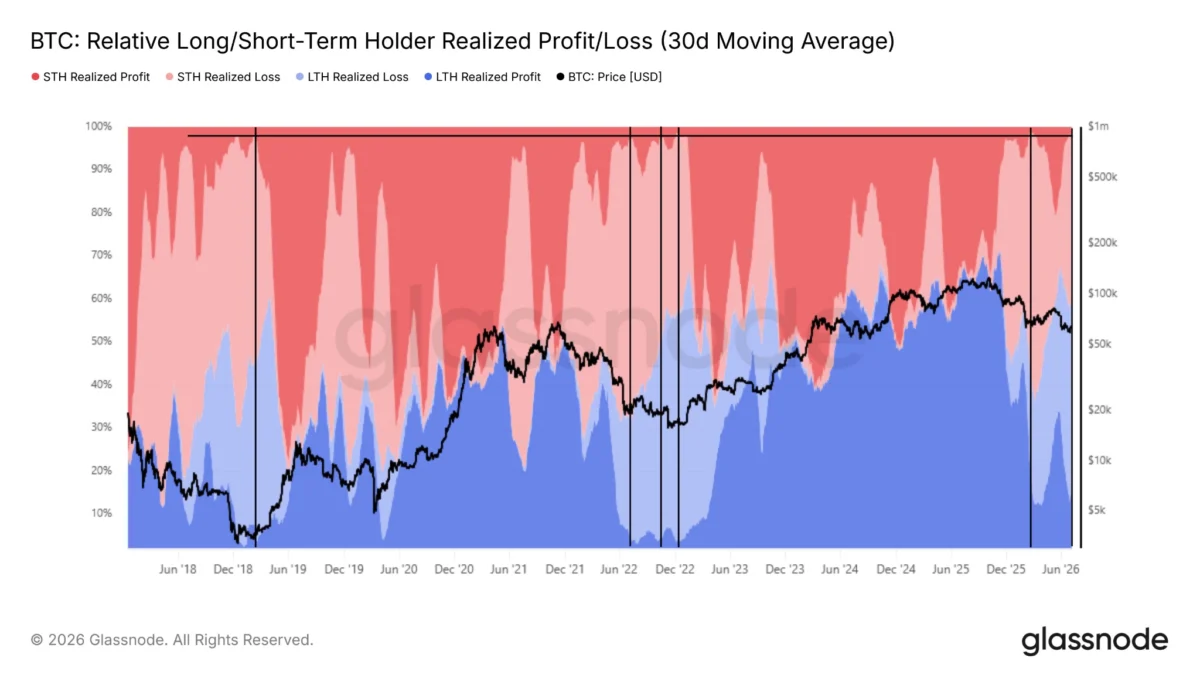
Glassnode’s analysis demonstrates that short-term holder (STH) realized losses have surged to levels documented only six times throughout Bitcoin’s entire trading history. Short-term holders are typically defined as entities that have held Bitcoin for less than 155 days. "Realized losses" occur when these holders sell their Bitcoin at a price lower than their acquisition cost. A surge in realized losses among STHs often indicates a capitulation event, where newer or less patient investors sell their holdings at a loss, often driven by fear or market downturns. Historically, in each of those six instances where STH realized losses reached such elevated levels, Bitcoin was positioned near or at a cyclical bottom. This pattern suggests that periods of intense selling pressure from short-term holders often mark the cleansing phase of a market cycle, paving the way for eventual recovery. The most recent occurrence of this pattern was observed in January of this year, when Bitcoin reached approximately $60,000 before embarking on a significant rally that saw its price climb to $82,000. This historical precedent lends considerable weight to the current data, hinting at the possibility that the market may be forming a durable base.
Further supporting the notion of a potential accumulation phase, Glassnode’s data indicates that large holder wallets have collectively accumulated approximately 10,000 BTC throughout the current month. "Large holders," often referred to as "whales," are typically institutional investors or individuals holding substantial amounts of Bitcoin. Their accumulation patterns are closely watched as they often possess deeper market insights and conviction. The preceding two months similarly recorded positive net additions by these large holders. This sustained buying activity, even during periods of price volatility or decline, is viewed by market analysts as a strong indicator of a probable accumulation phase. During accumulation, savvy investors strategically acquire assets at lower prices, anticipating future appreciation. The consistent net additions from large holders suggest a long-term bullish outlook from significant market players, reinforcing the narrative that the market might be consolidating before a potential upward move.
Technical Validation: The Road Ahead for BTC
From a technical analysis perspective, Bitcoin’s recent price action has given rise to a discernible "double-bottom" or "W-shaped" configuration on the daily timeframe chart. This technical pattern is widely regarded in financial markets as a bullish reversal signal, frequently preceding substantial upward price movements. A double-bottom pattern forms when an asset’s price drops to a low, rebounds, then drops to a similar low again, and finally rebounds once more, breaking above the previous resistance level (the peak between the two bottoms). This pattern indicates that sellers have twice attempted to push the price lower but failed, suggesting that buying pressure is strengthening.
For this bullish structure to be formally validated, Bitcoin must secure a decisive close above $66,000. This level represents the neckline of the "W" pattern, and a breakout above it would confirm the pattern’s completion and project a significant upside target. However, despite the recent rebound, the Relative Strength Index (RSI), a momentum oscillator that measures the speed and change of price movements, currently stays below the 50 level. An RSI below 50 typically indicates that momentum is still bearish or neutral, suggesting that a strong bullish confirmation has not yet materialized at this stage. This divergence between the nascent price recovery and the lagging momentum indicator suggests caution and emphasizes the importance of the $66,000 breakout.
Market analysts suggest that a potential decline toward $60,000 remains a plausible scenario before any more significant upward movement fully develops. This could be a retest of support or a final shakeout of weaker hands. Should BTC fall below that critical $60,000 threshold, the next major support level is referenced at $50,000, which would represent a more substantial correction and potentially invalidate some of the bullish patterns. Conversely, if Bitcoin successfully maintains levels above $60,000, analysts are forecasting a retest of the 200-day exponential moving average (EMA) positioned near $74,000. The 200-day EMA is a widely watched long-term trend indicator; crossing above it would signal a significant shift from a bearish to a bullish long-term trend.
Broader Impact and Bitcoin’s Evolving Macro Role
The events of the past 48 hours serve as a powerful reminder of Bitcoin’s evolving role within the global financial ecosystem. Once largely seen as an uncorrelated asset, its increasing integration into mainstream finance means it is now highly susceptible to major geopolitical shifts and macro-economic factors. The immediate reaction to President Trump’s statements on Iran, both the initial concern and the subsequent relief, highlights this growing sensitivity.
The cryptocurrency market, with Bitcoin at its forefront, continues to be characterized by periods of intense volatility, driven by a complex interplay of technical analysis, on-chain fundamentals, and external macro events. The current trading range between $61,300 and $64,700 exemplifies this dynamic, with market participants closely observing the daily close for definitive directional confirmation. Whether the recent diplomatic signals from the White House provide the sustained catalyst for a broader relief rally or merely a temporary reprieve remains to be seen. However, the confluence of robust on-chain accumulation, historical patterns of short-term holder capitulation, and emerging bullish technical formations suggests that while volatility persists, the underlying structure for a potential market recovery is slowly strengthening. Investors will be keenly watching key price levels and geopolitical developments in the coming days and weeks to ascertain Bitcoin’s next significant move.