Bitcoin is currently displaying a confluence of market-bottom indicators that have historically emerged at crucial cycle turning points, according to detailed analyses shared by prominent crypto analysts Ali Charts and Rand Group. These signals collectively point to a potential accumulation phase for the leading cryptocurrency, characterized by weakening net capital flows, an unusually prolonged period of subdued futures returns, and the asset’s strategic positioning near its long-term 200-week simple moving average (SMA). This alignment of on-chain, derivatives, and technical data suggests that the market may be nearing a significant inflection point, prompting a deeper examination of Bitcoin’s underlying market structure.
Net Capital Flows Replicate 2022 Bullish Divergence
One of the most compelling signals highlighted by Ali Charts is a distinct bullish divergence observed between Bitcoin’s price trajectory and its net capital flows. This pattern, characterized by a declining or stagnant price while the underlying capital flow metric shows improvement, indicates a diminishing selling pressure and a shift in capital movement dynamics. Crucially, this exact divergence was identified near the 2022 cycle bottom, a period when Bitcoin’s price hovered around $15,000 before embarking on a substantial and sustained rally. Following that previous divergence, Bitcoin experienced a significant percentage increase, eventually reaching new all-time highs and demonstrating the powerful predictive potential of this on-chain metric.
A bullish divergence fundamentally suggests that the underlying fundamentals or investor interest, as measured by capital entering or exiting the market, are improving even as the price lags. This disjunction implies that selling exhaustion may be setting in, and fresh capital is beginning to accumulate, albeit without immediate price appreciation. While not a standalone confirmation of a definitive market bottom, its recurrence, mirroring the 2022 scenario, lends considerable weight to the current analysis. The 2022 period saw a protracted bear market marked by significant institutional failures, including the collapse of Terra/Luna and FTX, and broader macroeconomic headwinds. The re-emergence of this divergence now, despite Bitcoin trading at significantly higher levels than its 2022 lows, underscores a similar underlying shift in market dynamics, where quiet accumulation may be preceding a more pronounced price movement. The subdued activity in the derivatives market, even with Bitcoin’s current valuation, further complements this narrative, suggesting a lack of aggressive bearish or bullish leveraged bets, often characteristic of accumulation phases.
Prolonged Futures Returns Lag Treasury Yields for 157 Days
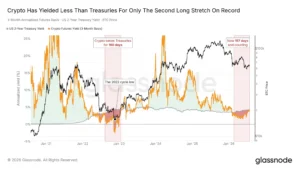
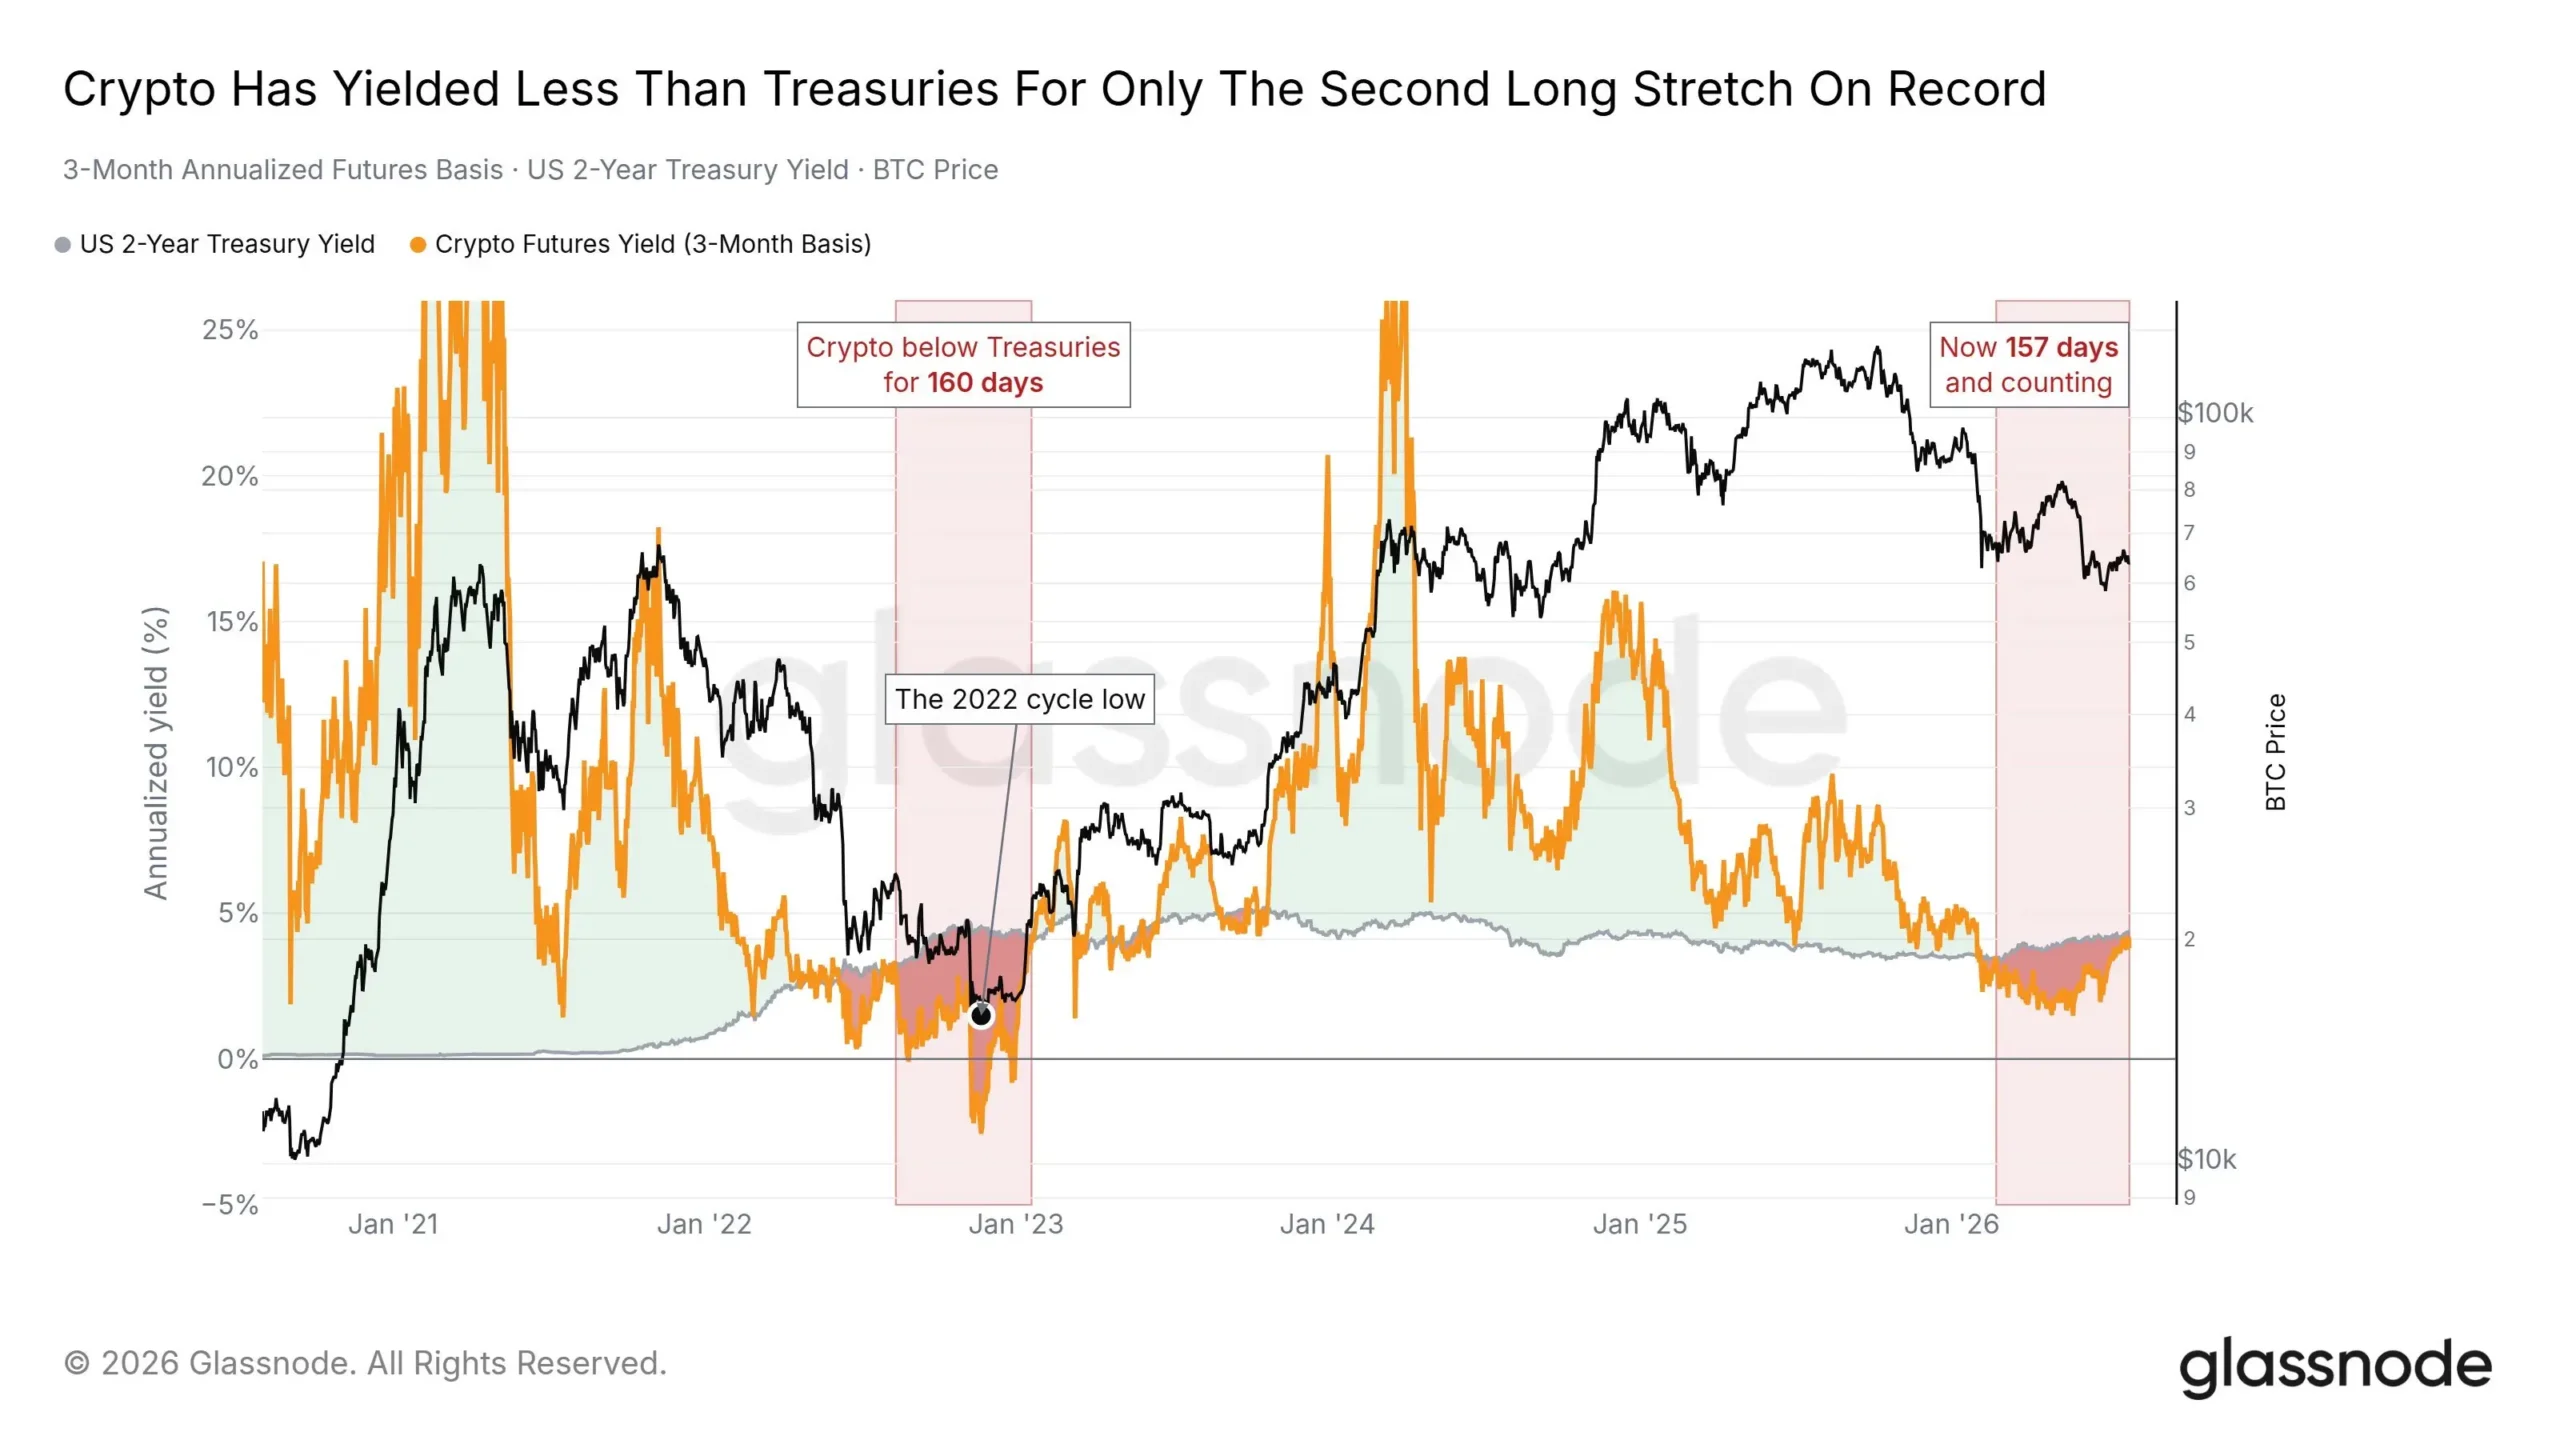
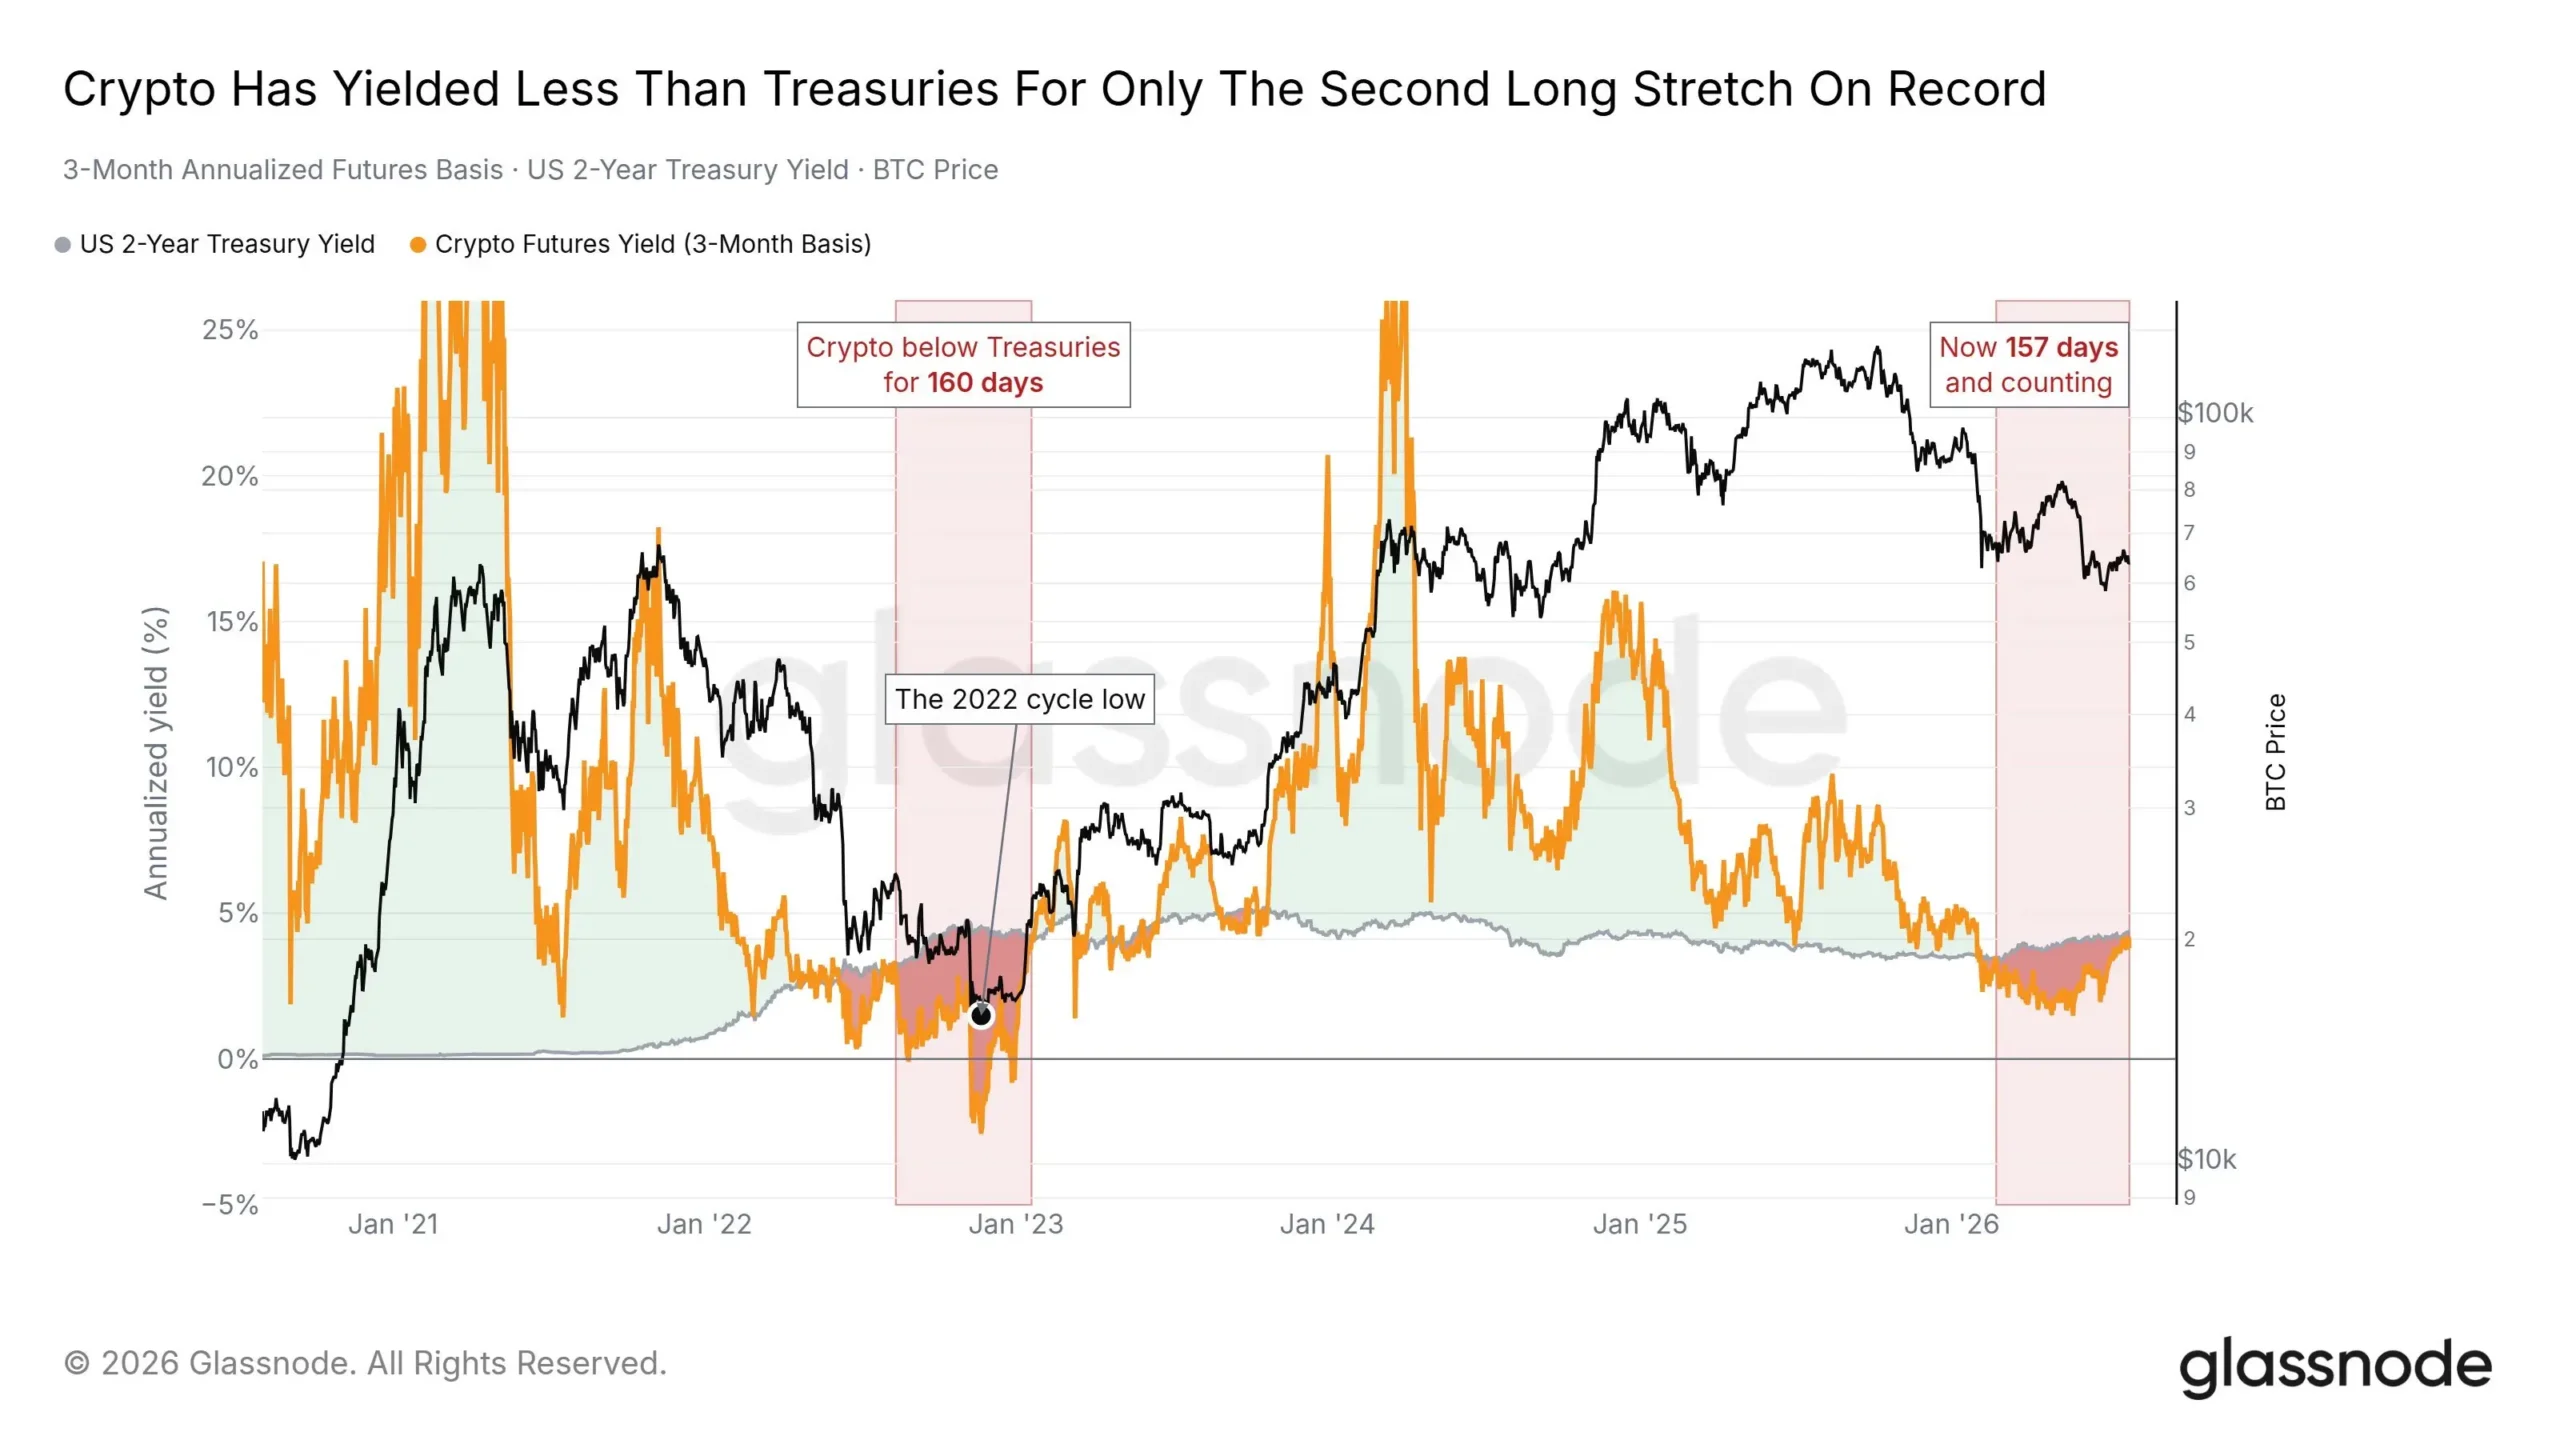
Adding another layer of historical comparison to the market-bottom thesis, Rand Group, citing Glassnode data, has drawn attention to a sustained decline in Bitcoin futures returns. Specifically, Bitcoin’s three-month annualized futures basis has remained consistently below the two-year United States Treasury yield for an unprecedented 157 consecutive days. This metric, the futures basis, quantifies the annualized premium at which futures contracts trade relative to Bitcoin’s spot price. A lower basis indicates weaker demand for leveraged bullish positions, as the incentive for traders to pay a premium for future delivery diminishes.
The significance of this metric is amplified when juxtaposed with traditional financial instruments. Treasury securities offer investors a relatively low-risk, albeit modest, return. When the annualized premium for holding Bitcoin futures falls below the yield offered by government bonds, the financial incentive for institutional capital, which often seeks arbitrage opportunities and yield, to flow into crypto futures is significantly reduced. This effectively means that for a considerable period, parking capital in a less volatile government bond has offered a better risk-adjusted return than engaging in leveraged Bitcoin positions.

According to Glassnode’s comprehensive dataset, the current 157-day stretch marks the second-longest such period on record. The only longer instance occurred between August 2022 and January 2023, lasting approximately 160 days. This earlier period precisely coincided with Bitcoin’s cycle-low formation, following months of relentless price declines, a cascade of institutional failures, and widespread deleveraging across the entire cryptocurrency ecosystem. Investors who exited Bitcoin during that inactive period subsequently missed out on a substantial price expansion, with the asset seeing a multi-fold increase from its lows. While historical performance is not an absolute predictor of future results, the striking parallel in market positioning — characterized by diminished institutional appetite for leveraged long positions — suggests a similar underlying environment of cautious accumulation rather than aggressive speculation. This prolonged period of low basis signals a "de-risking" phase where speculative froth has been largely purged from the derivatives market, creating a more stable foundation for future growth.
The 200-Week Simple Moving Average: A Defined Accumulation Zone
A critical technical indicator reinforcing the market-bottom narrative is Bitcoin’s proximity to its 200-week simple moving average (SMA). Ali Charts identifies this moving average as a pivotal long-term cycle benchmark, often acting as a key support level and a historical "accumulation zone" for astute investors. The indicator currently sits at approximately $63,777. With Bitcoin trading near $64,620 at the time of analysis, the asset is positioned just $843 above this crucial moving average, firmly placing it within a historically significant technical area.
The 200-week SMA has repeatedly served as a robust demand zone across Bitcoin’s history. Past instances where Bitcoin tested this benchmark include:
- August 2015: Followed by an approximately 8,500% gain.
- December 2018: Preceding a rally of around 267%.
- March 2020: Initiating an impressive 1,125% surge.
- Second half of 2022: Leading to a substantial 680% recovery from the cycle lows.
Each of these episodes, while developing under unique macroeconomic and market conditions, underscored the 200-week SMA’s role as a potent springboard for subsequent bullish cycles. The current re-test of this level, therefore, carries considerable weight for long-term investors and market analysts.
Despite these bullish implications, analysts also acknowledge the possibility of further price declines, typical of accumulation phases that can involve re-testing support levels. Ali Charts’ proposed buying strategy, for instance, advocates for a dollar-cost averaging approach, spreading investments between $58,000 and $40,000. This strategy accounts for potential downside targets, specifically identifying $54,000 and $40,000 as critical support levels that might be tested before a definitive bottom is established. Dollar-cost averaging mitigates the risk of trying to perfectly time the market bottom by investing a fixed amount at regular intervals, regardless of price fluctuations.
Chronology and Context: Understanding the Current Market Cycle
Bitcoin’s market cycles are intricately linked to its programmatic halving events, which reduce the supply of new Bitcoin entering circulation approximately every four years. The most recent halving occurred in April 2024, historically acting as a catalyst for subsequent bull runs. However, unlike previous cycles, the post-halving period has been marked by a broader macroeconomic environment characterized by persistent inflation and higher interest rates globally. The U.S. Federal Reserve’s stance on monetary policy, in particular, has a significant influence on risk assets like Bitcoin. Higher interest rates typically make safer investments, such as Treasury bonds, more attractive, drawing capital away from speculative assets.
The current market conditions follow a period of significant volatility. After reaching new all-time highs above $73,000 in March 2024, Bitcoin experienced a correction, which is a natural part of any market cycle. This correction, however, has brought the price back into a zone where historical indicators suggest strong underlying support and potential for accumulation. The previous bear market of 2022-2023, which saw Bitcoin plunge from its 2021 highs, was a brutal period driven by a confluence of factors: aggressive interest rate hikes by central banks, the collapse of major crypto entities like Terra/Luna and FTX, and general deleveraging across the industry. The market’s resilience and subsequent recovery from those lows, largely driven by anticipation of spot Bitcoin ETFs and institutional adoption, set the stage for the current environment.
The fact that these market-bottom indicators are re-emerging now, after a significant run-up and a subsequent correction, rather than at absolute multi-year lows, suggests a more mature market. It indicates that the mechanisms of market psychology and capital flow are still at play, but perhaps with a different set of catalysts and investor demographics. Institutional participation, significantly boosted by the approval of spot Bitcoin ETFs in the U.S. in January 2024, has introduced a new dynamic, where traditional finance players are more actively involved, potentially influencing capital flows and derivatives markets in novel ways.
Broader Implications and Market Outlook
The convergence of these three distinct yet complementary indicators — improving net capital flow divergence, compressed futures returns relative to Treasury yields, and a re-test of the 200-week SMA — paints a compelling picture for Bitcoin’s near-term future. Each indicator measures a different facet of Bitcoin’s market structure: capital flows track the actual movement of money, the futures basis reflects derivatives positioning and institutional sentiment, and the moving average captures the long-term price trend and historical support levels. Their simultaneous appearance amplifies their individual significance.
Should these signals indeed precede a confirmed market bottom and a subsequent accumulation phase, the implications for investors could be substantial. For retail investors, it presents an opportunity to accumulate Bitcoin at levels historically associated with attractive entry points for long-term holdings. For institutional players, a sustained period of low volatility and potential for upside could reignite interest, particularly if macroeconomic conditions stabilize and interest rates begin to decline. The current environment, where leveraged speculation is subdued, also suggests a healthier market structure, less prone to dramatic liquidations and more reflective of fundamental demand.
However, it is crucial to emphasize that none of these indicators independently guarantees that Bitcoin has established its final market bottom. The cryptocurrency market remains inherently volatile and susceptible to external shocks, including regulatory changes, global economic shifts, and unforeseen technological developments. Instead, their convergence provides a robust framework for understanding current market positioning, placing present conditions squarely within measurable levels historically associated with the accumulation phases of previous cycles. Market participants are advised to exercise caution, conduct thorough due diligence, and consider their individual risk tolerance. The coming weeks and months will be critical in determining whether these powerful signals translate into a sustained upward trajectory, marking the definitive end of the current consolidation phase and the beginning of Bitcoin’s next major market cycle.