

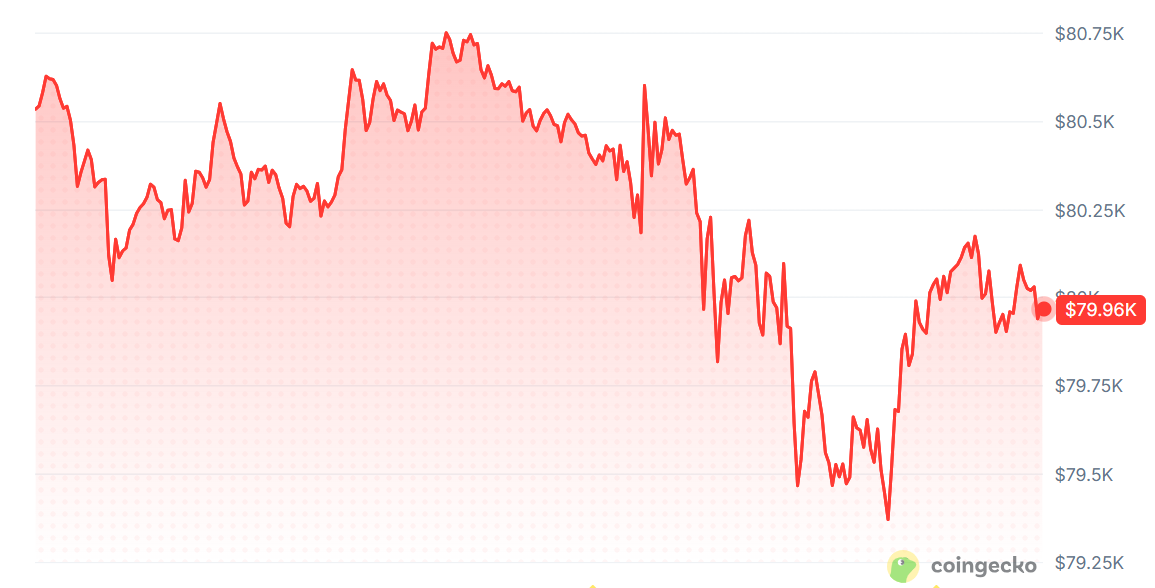
Bitcoin, the world’s leading cryptocurrency, registered a trading price of $79,757.25 as market analysts dissected recent price movements, with prominent figures like Ali Charts identifying $72,500 as a significant potential buying zone following a notable chart breakdown. This downward pressure comes after a period of considerable volatility, prompting a renewed focus on key support and resistance levels across the digital asset landscape.
According to data compiled by CoinGecko, Bitcoin experienced a decline of 0.74% over the preceding 24 hours, extending its weekly losses to 3.22%. The cryptocurrency’s 24-hour trading volume stood at a substantial $18,307,119,776, indicating active market participation despite the correctional phase. Further analysis of liquidation heatmaps revealed concentrated exposure both above and below the current market price, suggesting potential for sharp movements in either direction as leveraged positions come under pressure.
Current Market Snapshot and Recent Performance
The recent dip has drawn attention to Bitcoin’s inherent volatility, a characteristic well-known to investors. While the 24-hour and seven-day declines might seem modest in the context of Bitcoin’s historical swings, they signal a shift in immediate market sentiment, moving away from the bullish momentum observed in earlier periods. The significant trading volume underscores the high level of interest and activity surrounding Bitcoin, even during price corrections. Large trading volumes during downturns can sometimes indicate capitulation by weaker hands or robust buying interest from those looking to accumulate at lower prices, adding complexity to short-term forecasts.
This period of consolidation follows what many analysts describe as a robust ascent earlier in the year, which saw Bitcoin challenging and, at times, breaching new all-time highs. The current correctional phase is viewed by some as a healthy recalibration, shedding overextended positions and allowing for the re-establishment of a more sustainable growth trajectory. However, the immediate challenge lies in determining the extent of this correction and identifying critical junctures where buying pressure might re-emerge.
Technical Breakdown: Ali Charts’ Perspective on a Potential Buying Zone
Renowned cryptocurrency analyst Ali Charts articulated a bearish short-term outlook, pointing to an apparent breakdown below a rising parallel channel on the four-hour chart. In technical analysis, a rising parallel channel is formed by connecting a series of higher highs and higher lows with two parallel upward-sloping trendlines. This pattern typically signifies an uptrend where price action remains contained within these boundaries, reflecting a controlled and sustained ascent.
A break below the lower boundary of such a channel is a significant technical event. It suggests that the underlying upward momentum has weakened considerably, and the established bullish structure is no longer holding. While it does not definitively predict the exact magnitude or duration of a subsequent decline, it serves as a strong indicator that the path of least resistance has shifted downwards. For Ali Charts, this breakdown was a critical signal.
Specifically, Ali Charts highlighted the $82,000 level as a pivotal resistance point. As long as Bitcoin’s price remains below this threshold, he anticipates a continued correction, with his analysis pinpointing $72,500 as a prospective buying zone. This target represents a potential further decline of approximately 9.1% from CoinGecko’s quoted price of $79,757.25 at the time of his analysis. In an X post, Ali Charts stated, "Bitcoin appears to have broken below a rising parallel channel on the 4-hour chart. As long as $82,000 holds as resistance, $BTC could continue correcting toward $72,500. That’s where I’ll be looking for the next buying opportunity."
It is crucial for traders and investors to distinguish between an analyst’s preferred buying level and a confirmed market reversal. Ali Charts’ assessment suggests that he would be looking to enter new long positions at $72,500, implying a strategy based on "buying the dip" rather than expecting an immediate rebound from current levels. This approach hinges on the expectation of further price depreciation before a new accumulation phase begins. The implication here is that patient investors might find a more favorable entry point should the market continue its correctional course towards this identified support.
Liquidation Dynamics: Dual Pressures from Liquidity Clusters
Complementing Ali Charts’ technical analysis, insights from "That Martini Guy" introduced the concept of liquidation clusters, revealing the complex interplay of leveraged positions that could influence Bitcoin’s immediate price trajectory. Liquidation heatmaps, which visualize areas where significant amounts of leveraged long or short positions are concentrated, indicate where price movements could trigger cascading liquidations.
That Martini Guy’s one-week heatmap analysis showed a substantial liquidity cluster positioned just above $81,000. This cluster primarily comprises short positions, meaning traders betting on a price decline. If Bitcoin’s price were to move upwards and reach this level, it could trigger a "short squeeze." A short squeeze occurs when the price rises, forcing short-sellers to buy back their assets to cover their positions and prevent further losses. This forced buying adds further upward pressure, potentially accelerating the price rally as Bitcoin advances through these concentrated positions. That Martini Guy suggested that a move towards $82,000 could become "interesting" if short liquidations begin to trigger.
However, the market’s dynamics are rarely one-sided. The same heatmap also illustrated significant liquidity below $80,000, including another notable pocket concentrated around the $78,000-$79,000 range. These lower liquidity clusters primarily represent long positions, where a downward price movement could trigger liquidations, adding selling pressure. That Martini Guy emphasized the importance of $81,000 as a critical level for bulls to reclaim, indicating that a sustained break above this point would be a positive signal. Conversely, he warned that a loss of the $79,000 area would shift focus to downside liquidity, making further declines more likely.
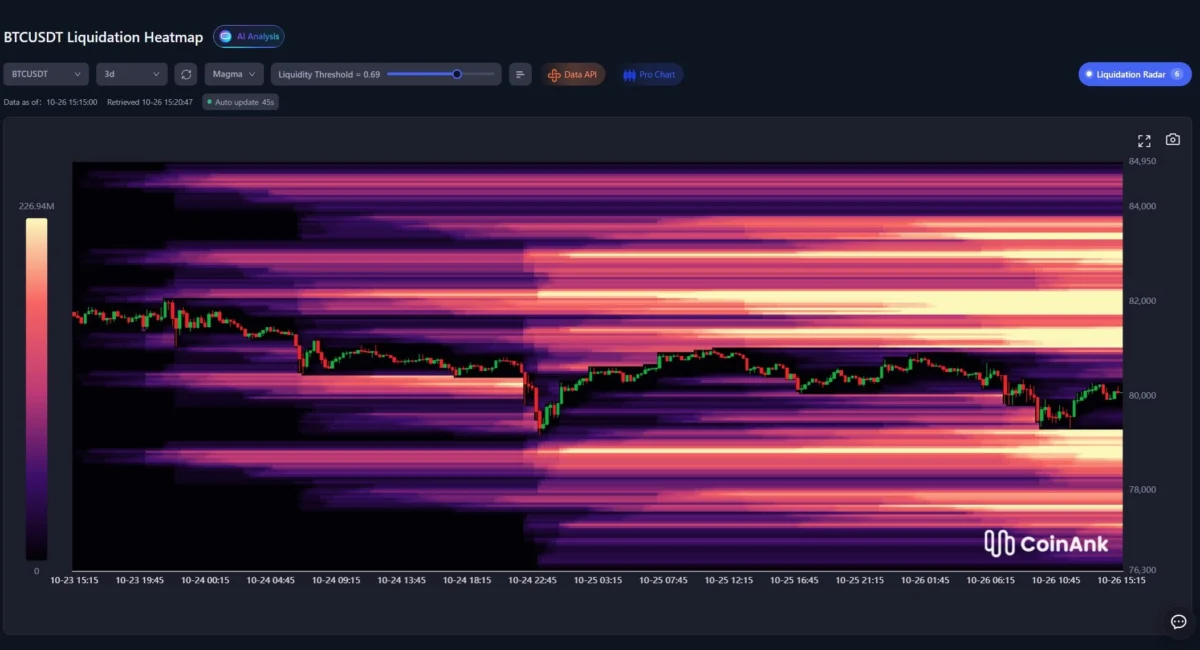
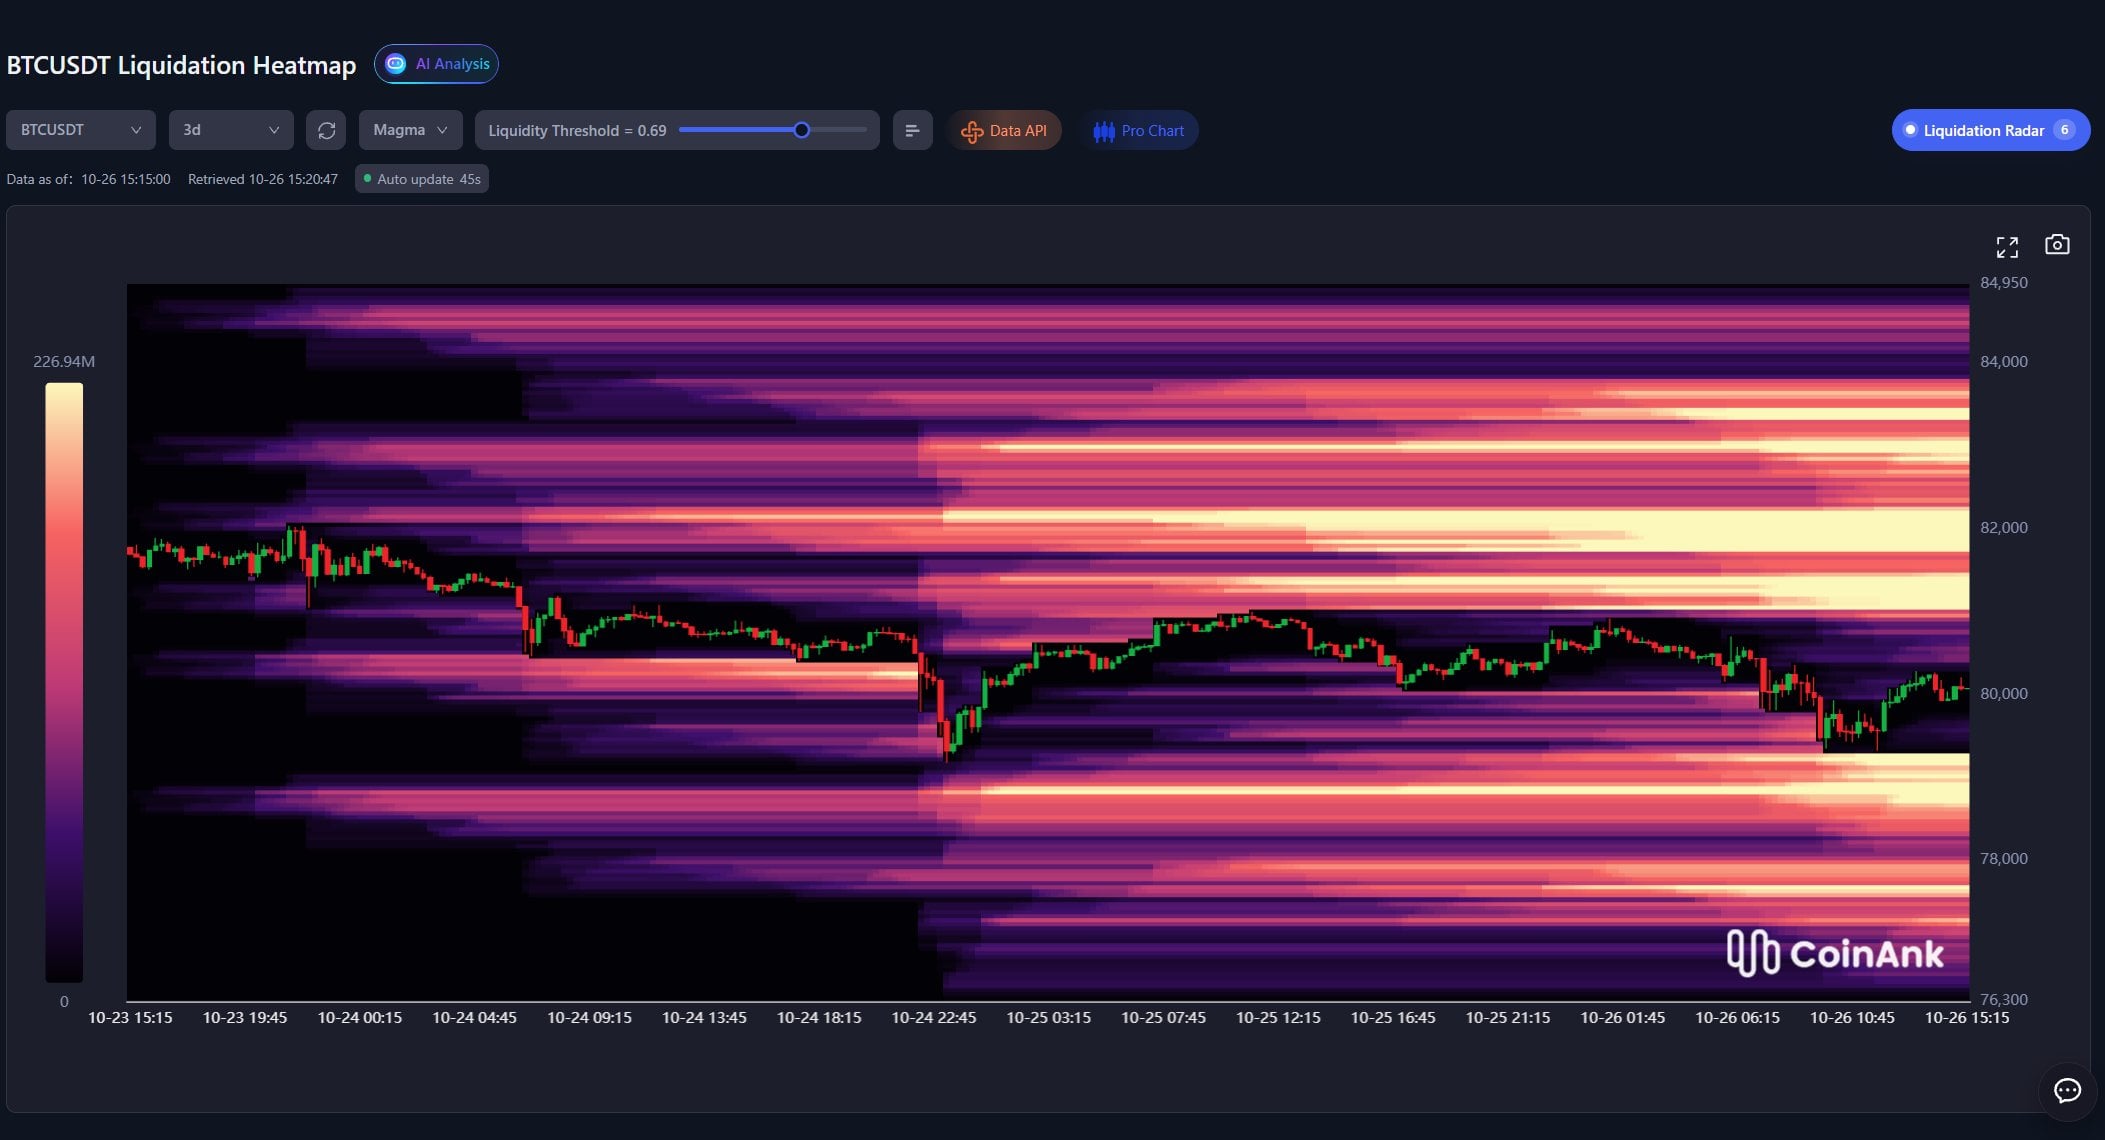
Another perspective from CoinAnk, utilizing a three-day BTCUSDT heatmap, corroborated these observations. After Bitcoin’s decline from approximately $82,000, CoinAnk’s data revealed a dense overhead band of liquidation concentrations stretching between $81,500 and $82,000. Below the current price, a lower concentration was observed around $78,500-$79,000. CoinAnk noted that the recent price decline had effectively "cleared" liquidation concentrations from the middle of this range, meaning that fewer leveraged positions now exist between the current price and these identified clusters. This situation leaves traders intently watching the remaining clusters as potential magnets for renewed price pressure in either direction, underscoring the delicate balance of supply and demand.
Broader Market Context and Macroeconomic Influences
Bitcoin’s price movements do not occur in a vacuum. While technical analysis and on-chain data provide granular insights, broader macroeconomic factors and the overall sentiment in traditional financial markets often exert an influence. During periods of global economic uncertainty, central bank policy shifts, or significant geopolitical events, investor risk appetite can fluctuate dramatically. As a relatively nascent and volatile asset class, cryptocurrencies, including Bitcoin, are often sensitive to these shifts.
For instance, expectations regarding interest rate hikes, inflation data, or even the performance of major stock indices can indirectly affect capital flows into and out of digital assets. While the original article does not delve into these macro aspects, it’s a generally accepted principle that the cryptocurrency market, despite its unique characteristics, is increasingly intertwined with the global financial system. Institutional adoption, particularly with the advent of Bitcoin exchange-traded funds (ETFs) in various jurisdictions, has further cemented this connection, making Bitcoin susceptible to broader investment trends.
Historical Precedents and Bitcoin’s Volatility Cycle
Bitcoin’s history is replete with significant price corrections, often followed by periods of robust recovery. From its earliest days, characterized by extreme volatility, to its more recent maturity as a multi-trillion-dollar asset class, Bitcoin has undergone numerous drawdowns of 30%, 50%, or even 80% from its peak values. These corrections, while painful for some investors, have historically served as cleansing mechanisms, flushing out speculative excesses and allowing for healthier, more sustainable growth.
The current situation, where analysts are identifying potential buying zones after a breakdown, is not unprecedented. Many long-term Bitcoin investors and proponents view such dips as opportunities to accumulate at discounted prices, adhering to strategies like dollar-cost averaging. This historical context suggests that while short-term price action can be unpredictable and challenging, Bitcoin has demonstrated a remarkable resilience and upward trajectory over extended periods. Understanding these cycles is crucial for maintaining perspective during volatile phases.
Investor Sentiment and Strategic Considerations
The differing analyses from Ali Charts and That Martini Guy highlight the complex landscape investors must navigate. Ali Charts’ identification of a specific buying zone caters to those looking for a strategic entry point after a further dip, suggesting a cautious, patient approach. This perspective appeals to value investors or those employing a "buy the dip" strategy.
Conversely, That Martini Guy’s emphasis on liquidation clusters above the current price points to the possibility of a rapid upside movement driven by a short squeeze. This scenario would favor more agile traders positioned to capitalize on sudden surges. The presence of liquidation clusters on both sides, as indicated by both That Martini Guy and CoinAnk, underscores the highly leveraged nature of parts of the Bitcoin market. This can lead to exaggerated price movements as positions are forcibly closed, creating a dynamic environment where sharp reversals are always a possibility.
For retail investors, these technical nuances can be challenging to interpret. The key takeaway is the heightened uncertainty and the presence of significant price levels that could trigger substantial market reactions. Prudent investors are advised to exercise caution, manage risk effectively, and perhaps consider a diversified approach rather than concentrating all capital into a single, highly speculative trade based on short-term technical indicators.
Looking Ahead: Key Levels and Potential Scenarios
Bitcoin’s immediate future hinges on its ability to navigate these critical technical and liquidity zones. The most pressing test for bulls is to reclaim the $81,000 level and subsequently challenge the $82,000 resistance. A decisive break and sustained trading above $82,000 could invalidate the bearish breakdown scenario presented by Ali Charts and potentially trigger a short squeeze, propelling Bitcoin higher.
Conversely, a failure to hold the $79,000 area would intensify downside pressure, potentially paving the way for a more substantial correction. In this scenario, Ali Charts’ downside target of $72,500 would become increasingly relevant, representing a key psychological and technical support level where a significant influx of buying interest is anticipated.
The market remains at a crossroads, with strong forces pulling in both directions. The concentration of liquidation orders above and below the current price indicates that whichever direction Bitcoin moves decisively, it could trigger a cascade, amplifying the initial momentum. As of October 26, 2026, the digital asset community watches closely, balancing the cautious outlook of potential further corrections against the ever-present possibility of a swift rebound fueled by market mechanics. The coming days will be crucial in determining Bitcoin’s short-term trajectory and confirming whether the $72,500 mark will indeed serve as its next significant buying opportunity.