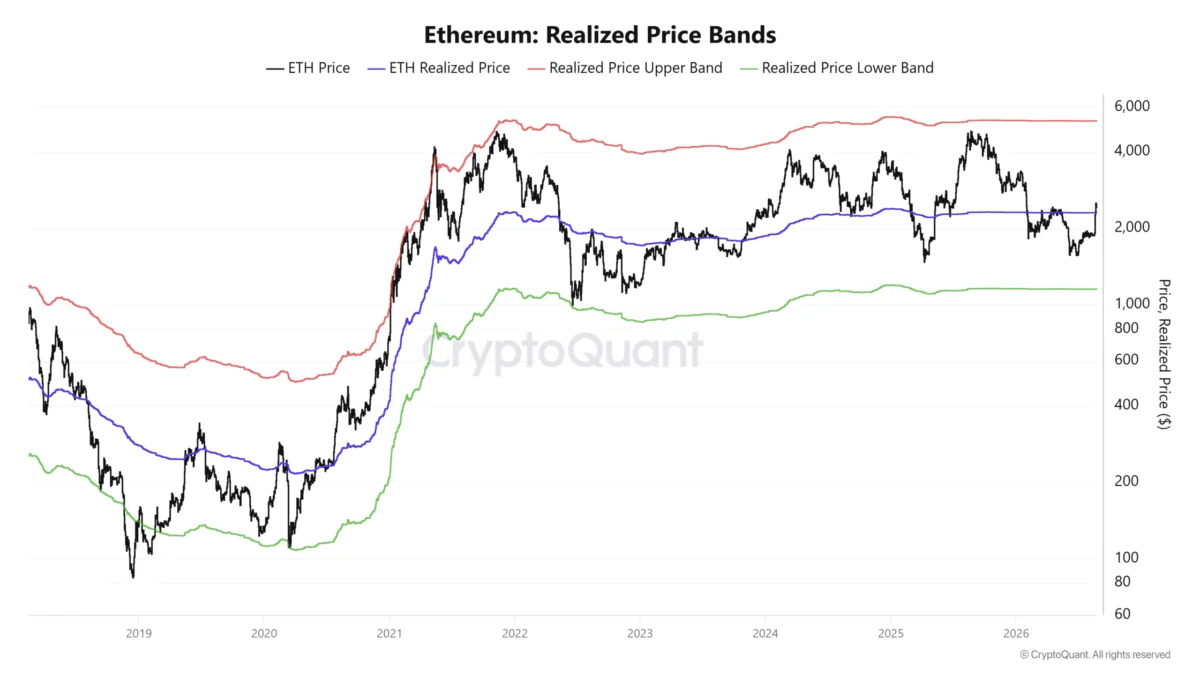
Ethereum, the world’s second-largest cryptocurrency by market capitalization, has demonstrated a remarkable resurgence, experiencing a surge exceeding 30% since the third week of August 2026, propelling its valuation within striking distance of the psychologically significant $2,500 mark. While a slight moderation in upward momentum has been observed, a confluence of robust technical indicators and strengthening fundamental metrics continues to signal a predominantly bullish sentiment across the market. This latest rally underscores a renewed confidence in the digital asset, driven by both retail and institutional participation, alongside favorable macroeconomic forecasts and significant shifts in on-chain activity.
Key Takeaways
- Ethereum has surged over 30% since mid-August 2026, approaching the $2,500 valuation, marking its most substantial weekly percentage gain since May 2025.
- Bitmine Chairman Tom Lee reported accumulating 34,000 ETH tokens, drawing parallels to historical rallies in July 2021 and May 2025 that saw subsequent gains of 167% and 170%.
- Lee anticipates further upside, citing a projected $1 trillion in Treasury repurchase programs expected to inject liquidity into risk-oriented digital assets.
- Technical analysis by Ash Crypto highlights ETH’s challenge of the Weekly 200-day Moving Average, a critical line for trend reversal, with potential targets between $2,800 and $3,400 if sustained.
- On-chain data indicates a strong funding rate for perpetual futures (0.01 on Binance), signifying heightened risk tolerance and a shift towards spot market products.
- ETH has breached its realized price benchmark of $2,306, while larger wallet addresses (10,000-100,000 ETH) accumulated 182,000 ETH, suggesting "smart money" accumulation.
- U.S. spot Ethereum ETFs have recorded $1.06 billion in net inflows in August 2026, marking the strongest monthly accumulation since August 2025, led by BlackRock and Fidelity.
- The overall ETH ETF ecosystem now manages $14.74 billion in net assets, representing nearly 5% of Ethereum’s total market capitalization, indicating growing institutional adoption.
- A "golden cross" technical formation has occurred, with the 20-day Exponential Moving Average crossing above the 200-day EMA, typically signaling a long-term bullish trend.
The Current Rally in Context: A Chronology of Ethereum’s Ascent
Ethereum’s impressive performance in late August 2026 follows a period of consolidation and, at times, volatility that characterized much of the preceding year. The rally began gaining significant traction in the third week of August, culminating in a +31% weekly advance, marking the most substantial weekly percentage gain witnessed since May 2025. This resurgence has brought ETH’s price to levels not consistently observed since the previous year, with its weekly closing price reaching a new high since May 2025.
Industry observers and analysts have been quick to draw historical parallels to previous periods of significant growth. Tom Lee, Chairman of Bitmine, a prominent digital asset investment firm, disclosed his firm’s strategic accumulation of 34,000 ETH tokens during the five-day window from August 17 through August 21, 2026. Lee emphasized the historical significance of the recent weekly percentage gain, noting its resemblance to similar large weekly candlestick formations observed in July 2021 and May 2025. Following those antecedent technical patterns, Ethereum subsequently embarked on substantial rallies, appreciating by 167% and 170% respectively in the ensuing periods. These historical precedents provide a compelling narrative for potential future performance, fueling optimistic projections among investors.
The broader macroeconomic landscape is also playing a pivotal role in shaping investor sentiment. Lee specifically highlighted anticipated Treasury repurchase programs, projected to inject approximately $1 trillion into the financial system. Such large-scale liquidity injections are historically known to enhance market liquidity and strengthen investor appetite for risk-oriented assets, including digital currencies. This potential influx of capital could serve as a significant catalyst, providing additional tailwinds for Ethereum and the broader cryptocurrency market.

Technical Indicators Signal Bullish Reversal
The technical analysis landscape for Ethereum has shifted decidedly bullish. Market analyst Ash Crypto, widely followed on the social media platform X, provided a detailed perspective, observing the +31% weekly advance and the establishment of Ethereum’s highest weekly closing price since May 2025. A key focus of his analysis is Ethereum’s current challenge to the Weekly 200-day Moving Average (MA), which he characterized as "the most important line for trend reversal." The 200-day MA is a widely respected long-term trend indicator; a sustained break above it is typically interpreted as a strong signal of a bullish reversal, indicating that the asset is entering a new uptrend.
Ash Crypto outlined two critical pathways for Ethereum’s price trajectory. A sustained close above the Weekly 200-day MA would, in his view, unlock significant upside potential, with price targets ranging between $2,800 and $3,400. Conversely, a failure to maintain these crucial levels could trigger a retracement, potentially pushing the price back towards $1,900 or even $1,500. This $1,500 level has previously acted as a strong long-term support zone, from which Ethereum demonstrated a robust bounce in earlier periods, suggesting its significance as a psychological and technical floor. The current price action around the 200-day MA is therefore being closely watched by traders and investors as a pivotal moment for Ethereum’s medium-term trend.
Further reinforcing the bullish technical outlook is the emergence of a "golden cross" technical formation. This pattern occurs when a shorter-term moving average crosses above a longer-term moving average, typically the 20-day Exponential Moving Average (EMA) crossing above the 200-day EMA. This event is widely regarded in technical analysis as a strong bullish signal, indicating that upward momentum is building and a long-term uptrend may be commencing. Such a signal often attracts additional buying pressure from trend-following traders.
In terms of immediate price levels, overhead resistance zones are identified at $2,678 and $2,865, representing potential hurdles for continued upward movement. On the downside, critical support levels are established at $2,431 and the 20-day EMA, which is currently located near $2,162. These levels will be crucial in determining the immediate trajectory of Ethereum’s price action.
On-Chain Metrics and Derivative Markets Reflect Confidence
Beyond price charts, on-chain analytics and derivative market data provide a deeper insight into the underlying health and sentiment of the Ethereum network. Data from CryptoQuant indicates that Ethereum’s perpetual futures funding rate on the Binance exchange has climbed to 0.01. This figure represents the most elevated measurement recorded over the past twelve months. The funding rate is a mechanism used in perpetual futures contracts to ensure that the contract price stays close to the underlying spot price. A positive funding rate means that long position holders are paying short position holders to maintain their leveraged exposure. An elevated positive rate, as seen currently, signifies an overwhelming bullish sentiment, where traders are willing to pay a premium to hold long positions, indicating strong confidence in future price appreciation.
CryptoQuant analyst Arab Chain noted that this ascending funding rate clearly demonstrates strengthened risk tolerance among market participants, with a discernible shift in preference towards spot market products. This move away from purely leveraged positions into direct ownership suggests a more fundamental and less speculative conviction in Ethereum’s long-term value.
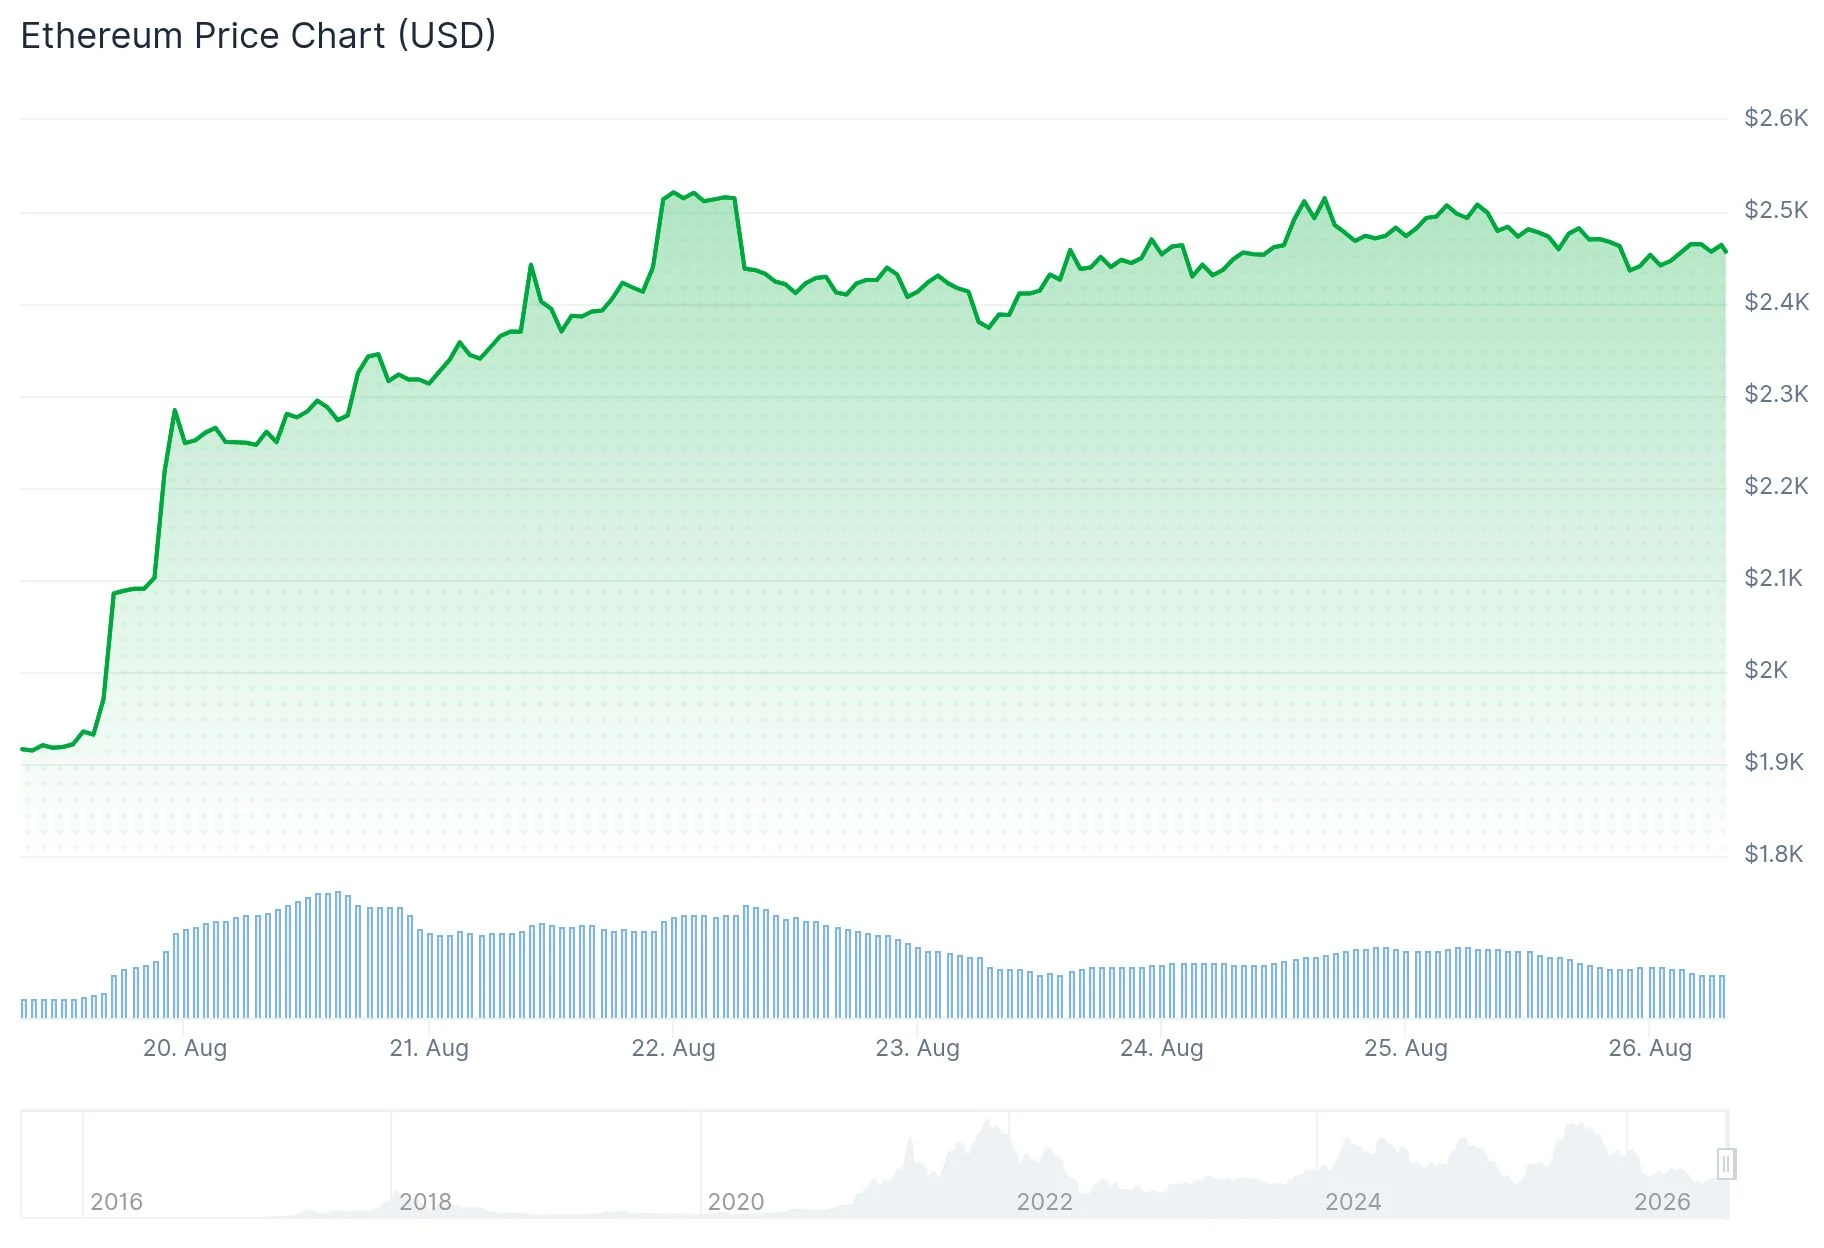
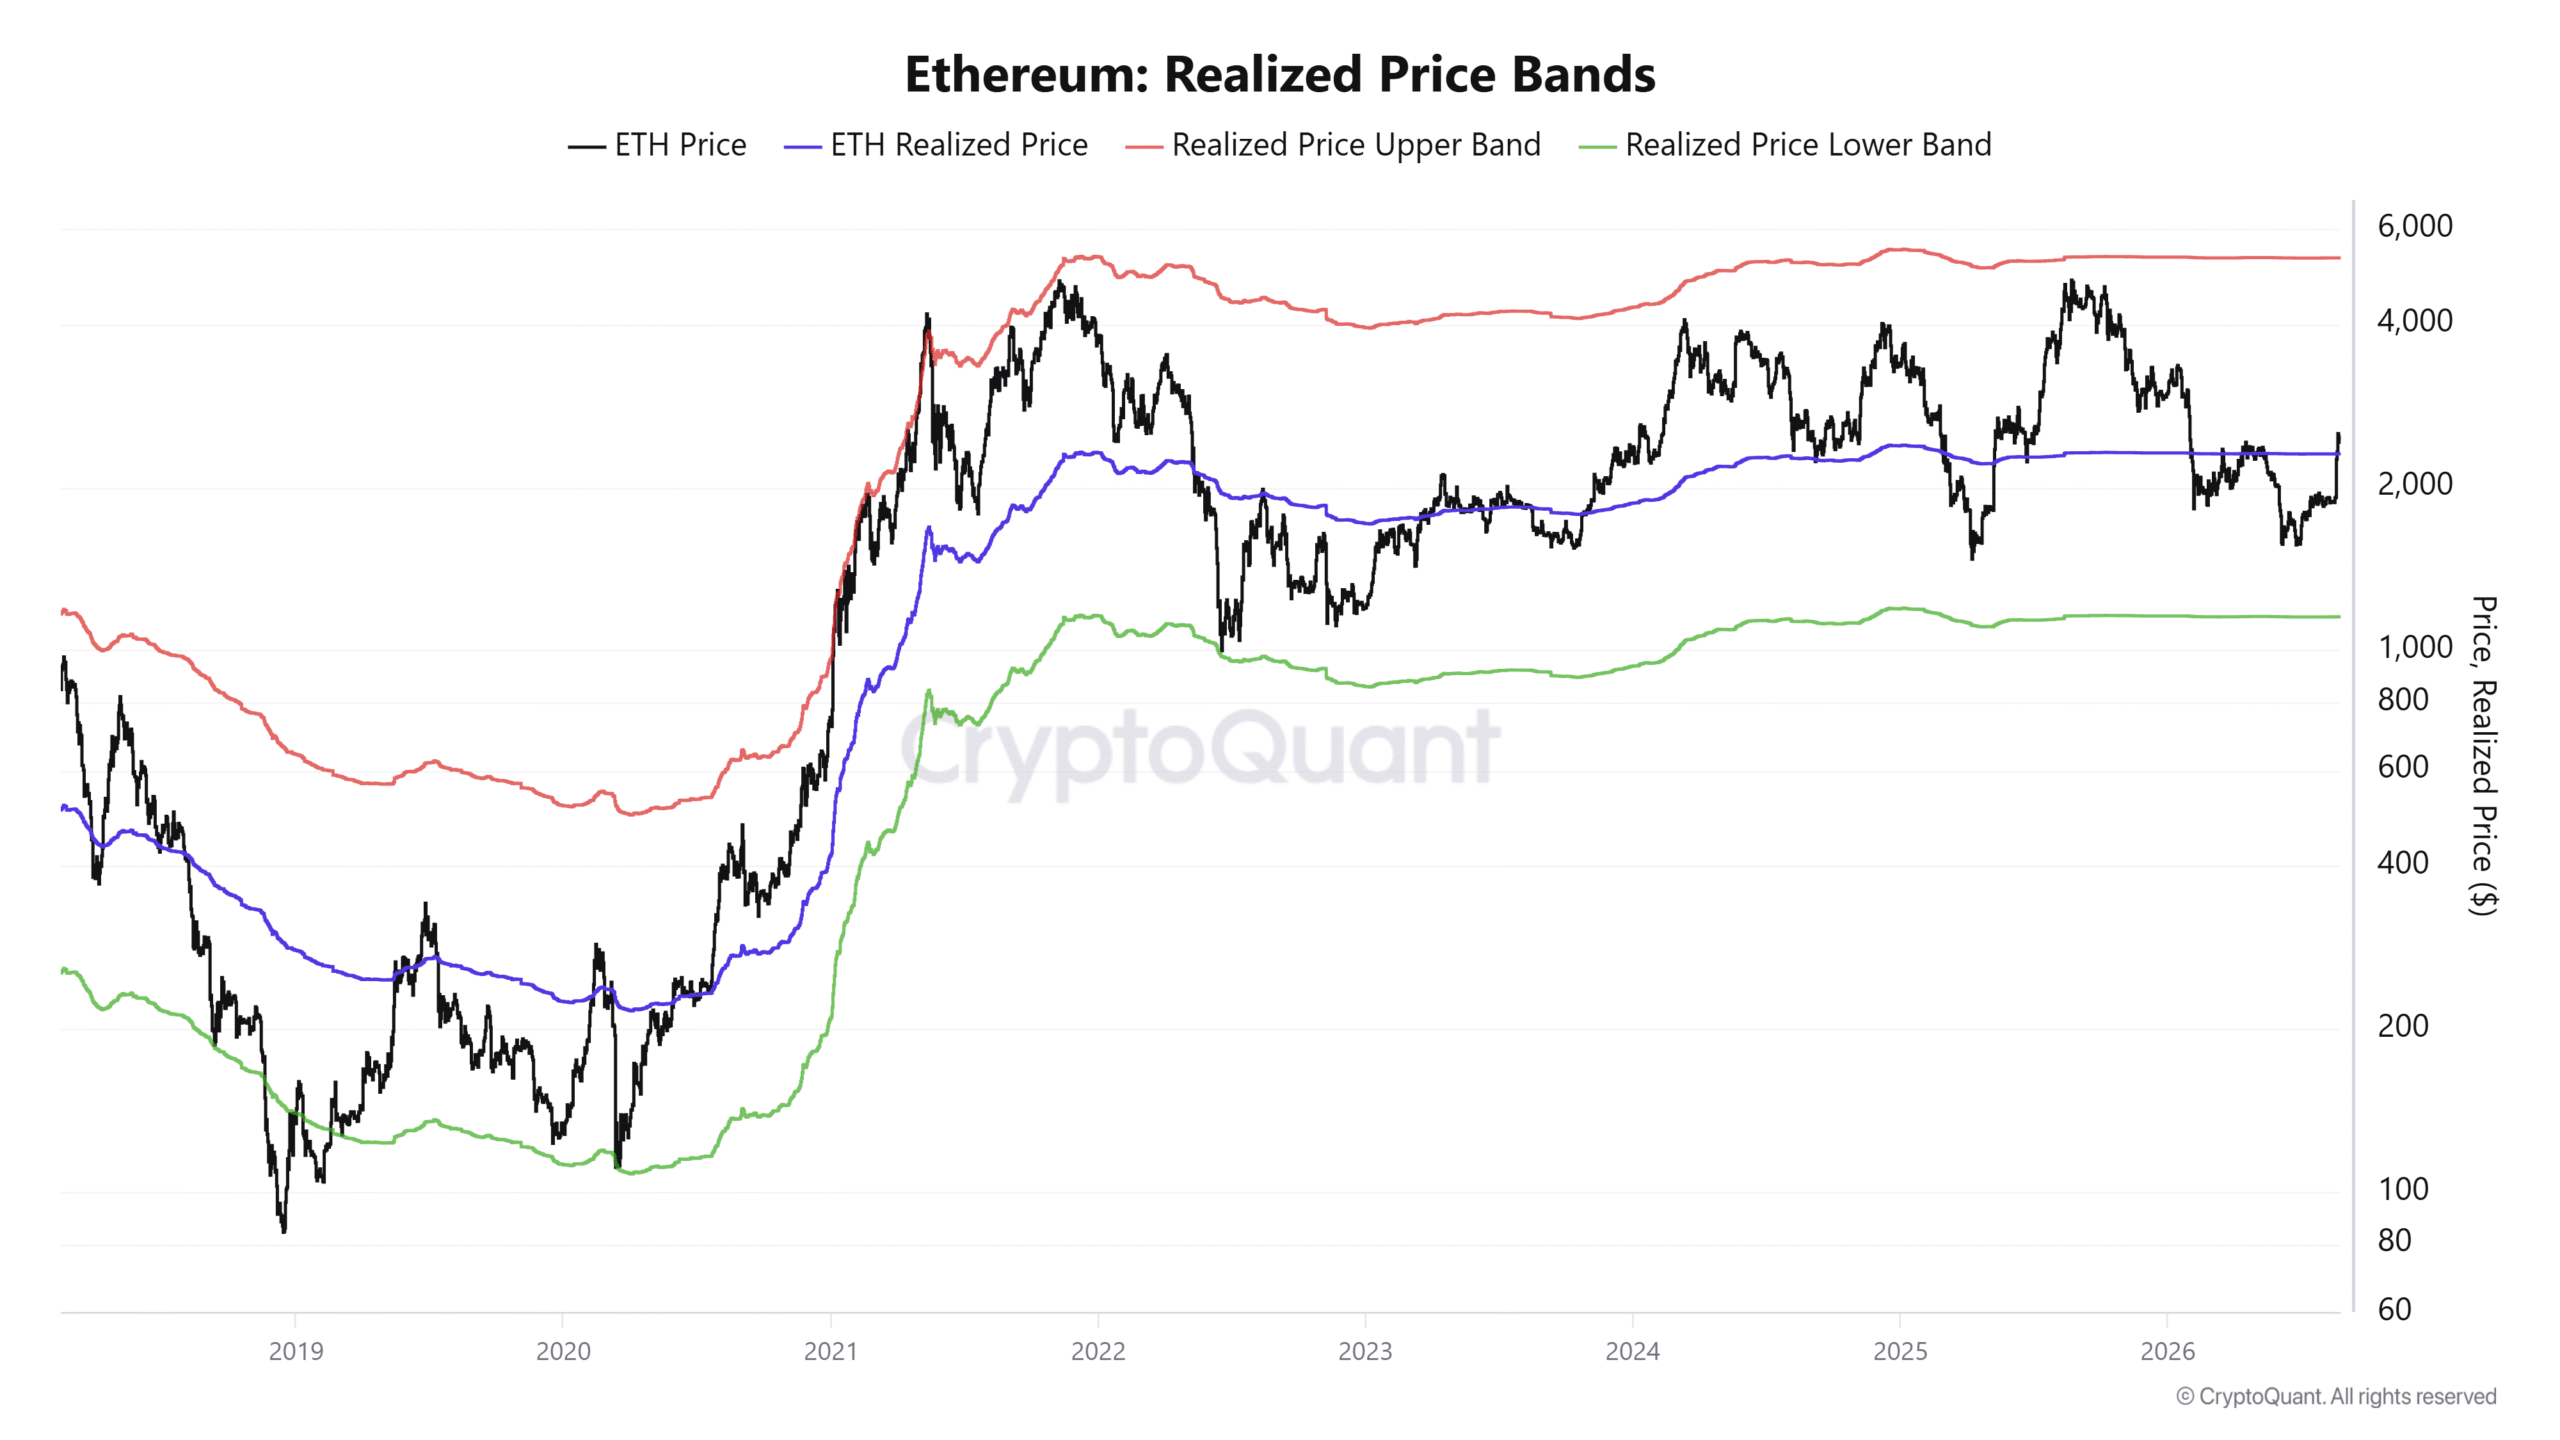
Blockchain analytics further reveal significant developments in the network’s intrinsic value and ownership distribution. Ethereum successfully breached its "realized price" benchmark of $2,306. The realized price is a crucial on-chain metric, representing the average acquisition cost across all network participants. When the market price moves above the realized price, it often indicates that the majority of holders are now in profit, historically signaling a transition from a bear market to a bull market or a sustained uptrend.
Analysis of wallet activity also provides compelling evidence of "smart money" accumulation. While smaller wallet addresses, those holding between 100 and 1,000 ETH, distributed approximately 207,000 ETH throughout the previous week, larger addresses, specifically those controlling 10,000 to 100,000 ETH, simultaneously accumulated an additional 182,000 ETH. This pattern, where smaller retail or speculative holders take profits while larger, potentially institutional or high-net-worth investors, increase their holdings, is often interpreted as a bullish sign, indicating that sophisticated market participants are positioning themselves for further growth. The net flow suggests a consolidation of supply into stronger hands, which can reduce selling pressure in the future.
Institutional Adoption: Spot Ethereum ETFs Reach Annual Peak
One of the most significant drivers of Ethereum’s recent rally, and indeed a monumental shift in the cryptocurrency landscape, has been the robust performance of United States-based spot Ethereum Exchange-Traded Funds (ETFs). These investment vehicles, which hold actual ETH, have registered an impressive $1.06 billion in net inflows throughout August 2026 to date. This figure not only highlights a surge in institutional interest but also establishes the strongest monthly accumulation recorded since August 2025, underscoring a growing appetite for regulated exposure to Ethereum.
The inflows have been predominantly led by major financial institutions. BlackRock’s iShares Ethereum Trust has dominated the market, attracting a staggering $814 million in new capital during this period. Fidelity’s Ethereum Fund also made a substantial contribution, capturing $81 million in inflows. The participation of such traditional finance giants like BlackRock and Fidelity lends considerable legitimacy and accessibility to Ethereum for a broad range of institutional and retail investors who prefer regulated investment products. The approval and subsequent success of these spot ETFs signify a critical inflection point, moving Ethereum further into the mainstream financial system and providing a regulated gateway for capital previously unable or unwilling to directly engage with cryptocurrencies.
The collective ETH ETF ecosystem now manages an aggregate of $14.74 billion in net assets. This represents a significant 4.93% of Ethereum’s total market capitalization. This growing percentage of market cap held by ETFs has profound implications. It indicates that a substantial portion of Ethereum’s circulating supply is being locked away in institutional custody, potentially reducing the available supply on exchanges and thus creating upward price pressure. Moreover, it signifies increasing institutional integration and potentially less volatility as these large holdings are typically long-term investments rather than short-term speculative trades.
Broader Impact and Future Implications
The recent surge in Ethereum’s price, coupled with strong fundamental and technical indicators, points to a potentially sustained bullish trend. The combination of institutional accumulation through ETFs, a positive macroeconomic outlook with anticipated liquidity injections, and strong on-chain metrics paint a comprehensive picture of a market gaining confidence.
The significant liquidation of $103.2 million during the most recent 24-hour trading cycle, with $69 million stemming from short position closures, further illustrates the market dynamics at play. Such short squeezes, where rapidly rising prices force short sellers to buy back assets to cover their positions, can amplify upward momentum and contribute to sharp price increases. This indicates that a significant portion of the recent rally was driven by the unwinding of bearish bets.
Looking ahead, Ethereum’s ecosystem continues to evolve with ongoing developments in its underlying technology, including scalability solutions (Layer 2 networks), sharding, and further refinements to its proof-of-stake consensus mechanism. These technological advancements, coupled with increasing adoption in decentralized finance (DeFi), NFTs, and enterprise solutions, continue to bolster its utility and long-term value proposition.
However, potential headwinds remain. Regulatory uncertainties, while somewhat mitigated by ETF approvals, still pose a risk in various jurisdictions globally. Furthermore, any significant shift in global macroeconomic policy, such as unexpected interest rate hikes or a contraction in liquidity, could impact investor sentiment for risk assets. Competition from other blockchain platforms also remains a factor, though Ethereum’s established network effect and developer community provide a strong moat.
Despite these potential challenges, the current momentum suggests that Ethereum is well-positioned for continued growth. The $2,500 threshold, while psychologically important, may prove to be merely a stepping stone as the asset leverages institutional capital, favorable macro conditions, and robust network fundamentals to potentially challenge higher valuations in the coming months. The journey towards $2,800 and potentially $3,400, as suggested by analysts, will depend on sustained institutional inflows, continued positive macroeconomic developments, and Ethereum’s ability to maintain its technical strength above key moving averages. The market watches closely as Ethereum navigates this pivotal period, potentially solidifying its position as a cornerstone of the digital economy.