
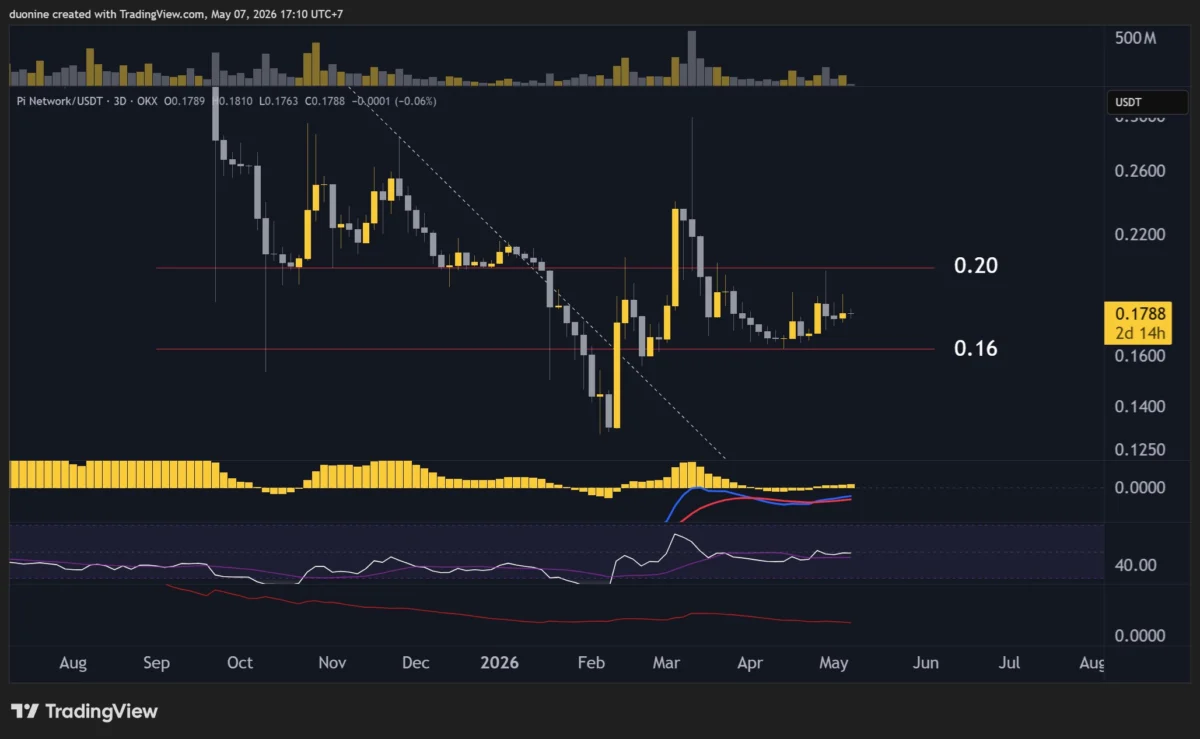
Since hitting a low of approximately $0.13, the price of PI Network’s native cryptocurrency, PI, has found itself confined within a narrow trading channel, oscillating between $0.16 and $0.20. This consolidation phase, which began in early March, has seen multiple attempts by buyers to breach the upper resistance level repeatedly thwarted. The most recent notable effort occurred in late April, where an initial surge in buying momentum was quickly extinguished by a significant spike in selling volume on two separate occasions. This price action resulted in PI retreating towards its established support at $0.16, underscoring the current equilibrium between supply and demand within this range.
PI Network Stuck in a Price Channel: A Technical Overview
The cryptocurrency market, known for its volatility, is currently witnessing PI Network’s price action exhibit a distinct pattern of consolidation. The digital asset has been trading within a well-defined horizontal channel, a technical formation that suggests a period of indecision among market participants. The lower boundary of this channel is firmly established at the $0.16 support level, a price point that has acted as a floor for PI on multiple occasions since early March. Conversely, the upper boundary, or resistance, is situated at $0.20. This level has proven to be a formidable barrier, with buyers struggling to generate sustained upward momentum to overcome it.
The period since March has been characterized by this persistent range-bound trading. Any rallies attempting to break above the $0.20 mark have been met with strong selling pressure, effectively pushing the price back down into the channel. This cyclical pattern suggests that neither buyers nor sellers have gained a decisive advantage, leading to the current stalemate.
A specific instance that highlights this dynamic occurred in late April. Buyers made a concerted effort to push PI’s price beyond the $0.20 resistance. However, this bullish attempt was short-lived. Data indicates that selling volume surged significantly on two occasions during this period, overwhelming the buying pressure. This aggressive selling pressure forced PI to retreat from its upward trajectory, ultimately bringing it back towards the $0.16 support level. This recurring pattern of failed breakouts and subsequent pullbacks is a hallmark of consolidation and often precedes a significant price move, though the direction remains uncertain.
Momentum Indicators Suggest a Stalled Trajectory
Technical analysis of PI Network’s price action reveals that momentum indicators have also mirrored the sideways movement of the asset’s price. Since March, as PI has oscillated within its trading channel, these indicators have shown a lack of directional conviction, frequently hovering around their mid-range levels. This flat momentum suggests that neither bullish nor bearish sentiment is currently dominating the market.

While trading volume saw an uptick in late April and into May, this increased activity was insufficient to catalyze a decisive breakout above the critical $0.20 resistance. This suggests that while there was increased interest, it did not translate into sustained buying pressure or a fundamental shift in market sentiment. However, the fact that volume increased during these attempted rallies could be interpreted as a sign of underlying demand that might be building.
The possibility of another attempt to break the $0.20 resistance remains a key consideration for traders and investors. Should PI manage to overcome this hurdle, the next significant target for bulls would be the $0.28 resistance level. This would signify a successful breakout from the current consolidation pattern and potentially mark the beginning of a new upward trend. Conversely, a failure to break above $0.20 could lead to further price depreciation, with the $0.16 support level being the immediate area of focus.
The Role of the Daily Relative Strength Index (RSI)
The daily Relative Strength Index (RSI) for PI Network has also been a key indicator of the current market sentiment, or lack thereof. Over the past week, the RSI has been closely tracking the midpoint, hovering around the 50-level. The RSI is a momentum oscillator that measures the speed and change of price movements. A reading above 70 typically indicates an overbought condition, while a reading below 30 suggests an oversold condition. Readings around 50, as observed with PI, generally signify a neutral market sentiment, with no clear dominance of buyers or sellers.
This persistent RSI behavior around the 50-mark directly correlates with the price’s sideways movement, creating a trading range approximately centered around $0.18. For PI to build a stronger bullish bias and potentially achieve a breakout, the daily RSI would ideally need to move decisively above the 50-point mark and begin trending towards the 70-level. Such a move would signal a resurgence of buying interest and could coincide with a renewed attempt to breach the $0.20 resistance.
The significance of the RSI moving above 50 cannot be overstated in this context. It would suggest that the buying momentum is starting to outweigh the selling pressure, providing the necessary fuel for a price ascent. A sustained move towards 70 would further bolster this bullish narrative, indicating that the market is becoming increasingly favorable for buyers. This scenario would likely be accompanied by increased trading volume and a clearer upward trajectory for PI’s price.
PI Network’s Broader Context and Potential Implications
PI Network’s current price action unfolds against a backdrop of its unique development model. Unlike many cryptocurrencies that launch with immediate public trading, PI Network has focused on a mobile-first mining approach, allowing users to accumulate PI tokens prior to a full public listing and exchange integration. This has created a distinct community of holders who are anticipating the project’s future development and potential for broader market adoption.
The limited trading history and the current consolidation phase suggest that the market is still in the process of discovering PI’s fair value. The key support at $0.16 and resistance at $0.20 represent critical price levels that will dictate the short-to-medium term trajectory.
Timeline and Key Developments:
- Early March: PI Network’s price bottoms out around $0.13, initiating a new trading range.
- March – Present: PI consolidates within a channel between $0.16 and $0.20, with repeated rejections at the upper boundary.
- Late April: A significant attempt to break above $0.20 is met with increased selling volume, pushing the price back towards $0.16.
- Recent Weeks: The daily RSI hovers around the 50-mark, indicating a lack of clear directional momentum.
Supporting Data and Analysis:
The observed trading channel suggests that a significant number of investors are holding PI within this price range. The repeated failures to break resistance at $0.20 indicate that there is substantial selling pressure at these levels, potentially from early adopters looking to take profits or from individuals who acquired tokens at higher prices. Conversely, the consistent defense of the $0.16 support level suggests a baseline of demand, where buyers are willing to step in and acquire PI at these lower prices.
The flat momentum indicators and the RSI’s oscillation around 50 are classic signs of a market in equilibrium. This can be a precarious state; a breakout from such a pattern can often be swift and significant. The direction of this breakout will likely be determined by a confluence of factors, including broader market sentiment, any upcoming developments within the PI Network ecosystem, and the effectiveness of future attempts to breach the key resistance levels.
Inferred Reactions and Market Sentiment:
While specific statements from PI Network officials regarding this price action are not publicly available in the provided text, the technical data suggests a cautious market. Investors are likely observing the price action closely, waiting for a clear signal of either a sustained upward trend or a confirmation of a bearish continuation. The community’s anticipation of future developments, such as potential exchange listings or increased utility for the PI token, will play a crucial role in shaping future price movements.
Broader Impact and Implications:
The consolidation phase for PI Network has several implications for the broader cryptocurrency market and its community:
- Discovery of Value: The current trading range is part of the market’s process of discovering PI’s intrinsic value. As more data and utility emerge, the price will eventually find a more stable footing.
- Investor Patience: The prolonged period of sideways trading requires patience from investors. Those who believe in the long-term potential of PI Network will likely remain holding, while short-term traders may seek more volatile assets.
- Catalyst for Breakout: A successful breakout above $0.20 could trigger a wave of buying interest, potentially attracting new investors and increasing liquidity. Conversely, a breakdown below $0.16 could signal a loss of confidence and lead to further price declines.
- Ecosystem Development: The price action is intrinsically linked to the ongoing development and adoption of the PI Network ecosystem. Positive news regarding partnerships, technological advancements, or increased user engagement could serve as catalysts for a bullish breakout.
- Market Sentiment Indicator: PI’s performance within this channel can also be viewed as a micro-indicator of broader sentiment towards new or less established cryptocurrencies. A successful breakout could signal a more positive outlook for such assets, while a failure might reinforce a more risk-averse sentiment.
The coming weeks and months will be critical for PI Network. The ability of buyers to overcome the $0.20 resistance, supported by increasing volume and a bullish shift in momentum indicators, will be key to determining whether PI can break free from its current channel and embark on a new price discovery phase, potentially targeting higher levels such as $0.28. Conversely, continued selling pressure at resistance could lead to a retest of lower support levels, necessitating a re-evaluation of the bullish outlook. The market is watching to see if PI can transform its current consolidation into a springboard for future growth.