
The cryptocurrency market, known for its inherent volatility, continues to present a challenging environment for investors. Among the numerous digital assets navigating these turbulent waters, the PI Network (PI) token has recently experienced a notable period of price correction. This downturn, which has persisted for several consecutive weeks, has sparked considerable interest regarding its potential trajectory in the coming days. Analysts are closely observing key support and resistance levels to gauge the sentiment and potential for a price reversal or further decline.
PI Correction Continues Amidst Sideways Movement
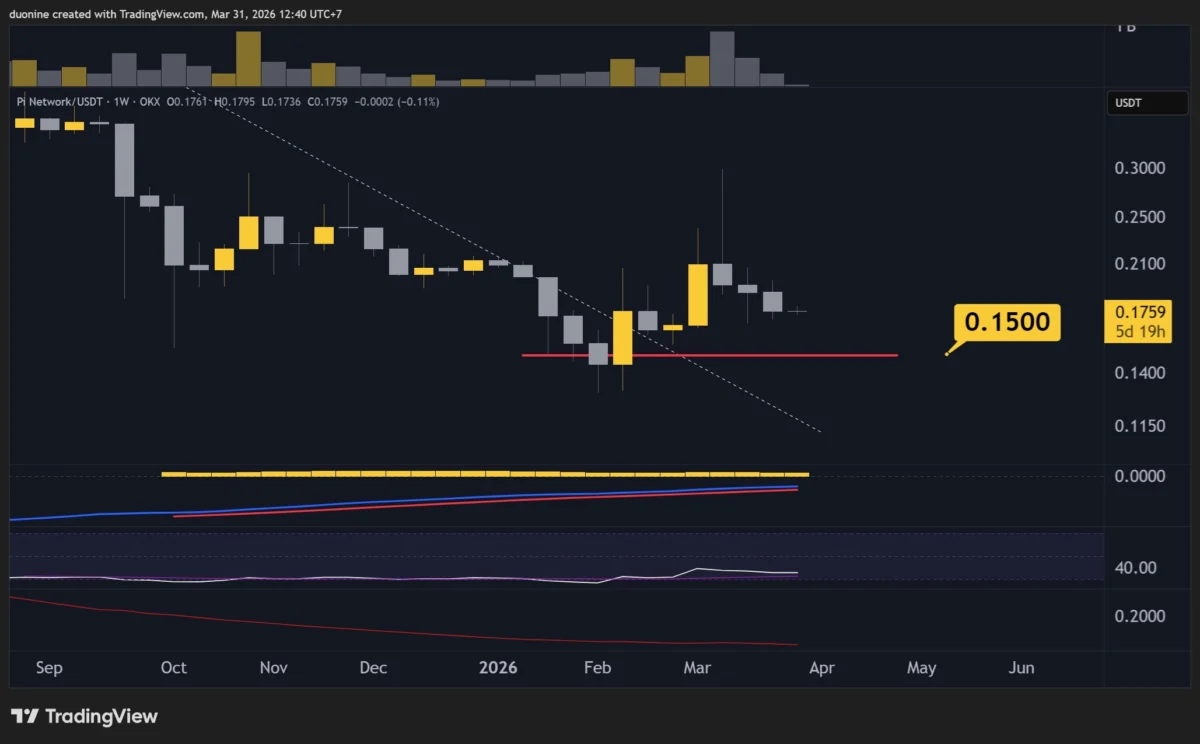
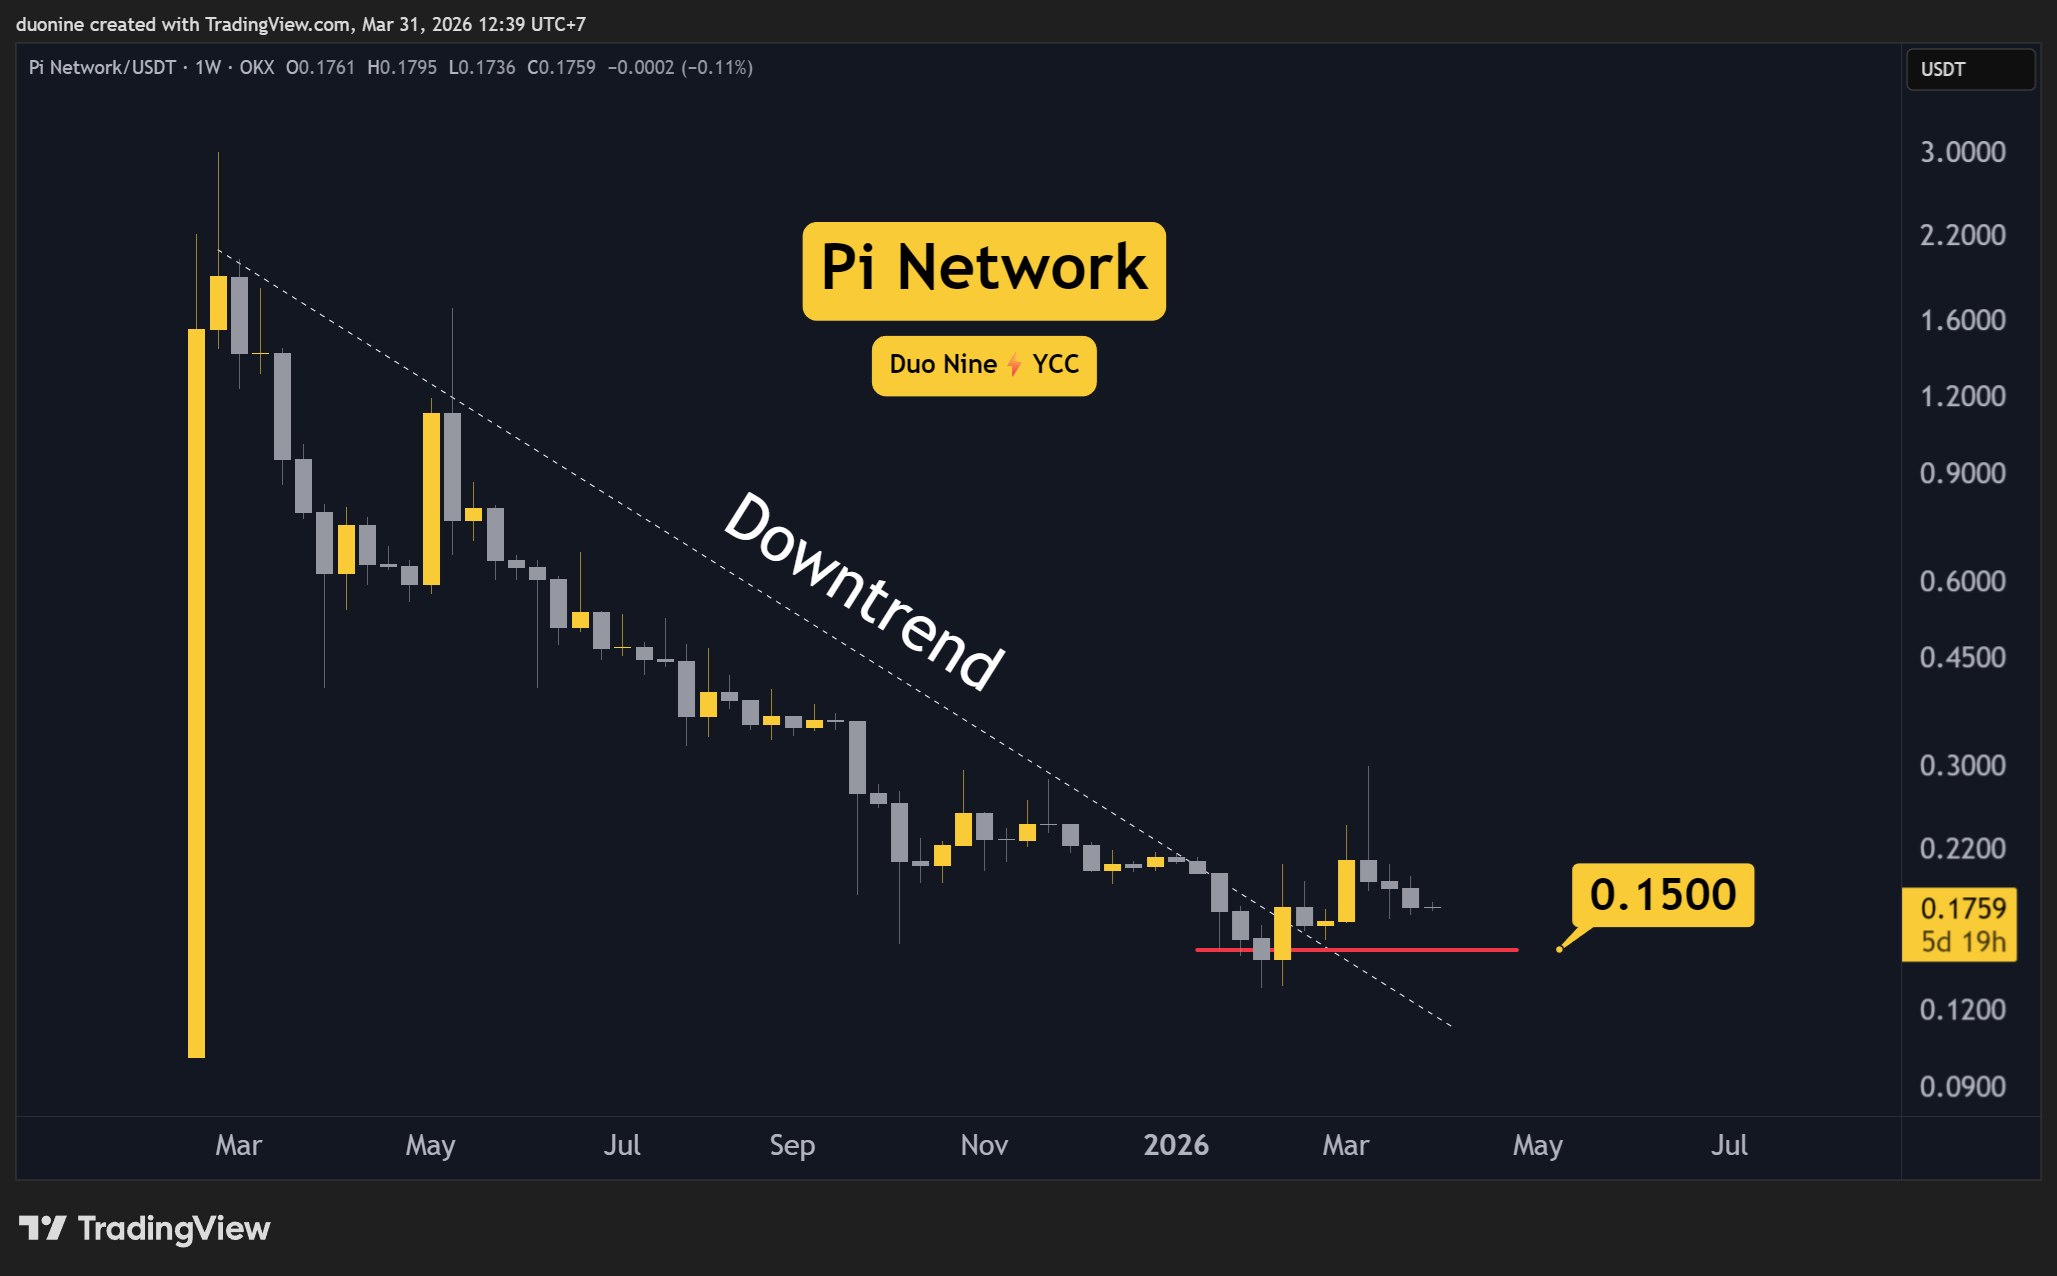
PI has witnessed a significant drop from its recent peak of $0.30, plummeting to approximately $0.17. This represents a substantial drawback of roughly 40%, a figure that, under normal market conditions, might be considered a sufficient correction for a bullish recovery. However, the past week has seen PI consolidating in a sideways pattern around the $0.18 mark, a development that is raising concerns among market observers.
This prolonged period of indecision can be interpreted as a double-edged sword. On one hand, the lack of significant downward momentum suggests that the selling pressure may be waning. On the other hand, extended consolidation at these levels can provide an opportunity for sellers to regroup and attempt to push the price to new lows. For PI to signal a potential bullish turnaround, buyers would need to re-enter the market with conviction and drive the price decisively above the $0.20 resistance level. Failure to achieve this upward momentum could embolden bears, potentially leading to further price depreciation.
Key Technical Indicators and Support/Resistance Levels
Technical analysis plays a crucial role in understanding the short-term outlook for any cryptocurrency. For PI, the following levels are of particular importance:
- Key Support Level: $0.15
- Key Resistance Levels: $0.20, $0.28
The $0.15 level is significant as it represents a crucial support zone. A break below this level could confirm a continuation of the downtrend, potentially targeting much lower price points. Conversely, a sustained hold above $0.15 would indicate resilience.
On the upside, the $0.20 level acts as immediate resistance. Overcoming this barrier would be the first step towards alleviating bearish sentiment. A stronger bullish signal would emerge if PI can successfully breach the $0.28 resistance, suggesting a more substantial recovery might be underway.
Volume Vanishes, Indicating Shifting Market Dynamics
A positive development amidst the ongoing correction has been the noticeable decline in trading volume. This reduction in activity typically implies that sellers are losing their aggressive stance or are adopting a wait-and-see approach. This decreased selling pressure has, in turn, allowed PI to trade sideways.
However, this quiet period does not automatically translate into a bullish reversal. The crucial factor remains whether buyers will step in to absorb the existing supply and initiate an upward trend. Without renewed buying interest, the current equilibrium is precarious.
If the market dynamics remain unchanged in the immediate future, the prevailing bias leans bearish. Sellers appear to hold a tactical advantage, and a decline towards the $0.15 support level seems plausible. This $0.15 mark is particularly noteworthy as it aligns with a significant breakout level from the major downtrend that commenced in early 2025. A retest of this level could therefore be a critical juncture for the PI token.
Daily RSI Under 50: A Lingering Bearish Signal
Further underscoring the cautious outlook, the Relative Strength Index (RSI) on the daily timeframe remains consistently below the 50-point mark. The RSI is a momentum oscillator used to measure the speed and change of price movements. A reading below 50 generally indicates that bears are in control of the market.
As long as the RSI struggles to break above this 50-point threshold, the prospects for a significant price reversal appear limited. While the moving average of the RSI has shown some upward curvature recently, this is not a definitive indicator of an impending uptrend. A robust bullish confirmation would require the RSI to not only break above 50 but also to establish higher highs, with a break above the last significant peak of approximately 52 points being a crucial benchmark.
Background and Context of PI Network
The PI Network is a project that aims to create a cryptocurrency accessible to the average person through mobile mining. Launched in 2019, it has garnered a significant user base due to its unique approach of allowing users to mine PI coins directly from their smartphones without requiring substantial computational power or electricity consumption. The project’s roadmap has consistently emphasized the development of its ecosystem, including the creation of a decentralized application (dIApp) platform and the eventual listing of PI on cryptocurrency exchanges.
The recent price action of PI is intrinsically linked to the broader development stages of the network. As PI moves towards its mainnet launch and potential exchange listings, market participants are keenly assessing its value proposition and future potential. The current price correction can be viewed as a natural phase of market price discovery, where speculative interest is tested against the underlying value and developmental progress of the project.
Timeline of Key Events
While specific dates for PI’s price movements are not provided in the source material beyond "a few consecutive weeks" and "past week," a hypothetical timeline can be constructed based on the analysis presented:
- Early 2025: Major downtrend begins for PI, establishing a significant bearish trajectory.
- Several Weeks Prior to Current Analysis: PI experiences a substantial price drop from $0.30 to $0.17, marking a 40% correction.
- Past Week: PI exhibits sideways consolidation around the $0.18 price point, with declining trading volume.
- Current Period: The market is at a critical juncture, with key support at $0.15 and resistance at $0.20 and $0.28. Daily RSI remains below 50, indicating bearish momentum.
Broader Implications for the Crypto Market
The price action of PI, like that of many altcoins, can offer insights into broader market sentiment. When established projects experience significant corrections, it often reflects a general risk-off sentiment within the cryptocurrency space. Investors may be rotating towards more established or less volatile assets, or they may be awaiting clearer macroeconomic signals.
The PI Network’s unique model of mobile mining has created a large community of users who are invested in the project’s success. The price performance of PI directly impacts the perceived value of their mined assets. A sustained downturn could lead to reduced enthusiasm among this user base, potentially affecting network growth and development. Conversely, a successful recovery and subsequent upward trend could reignite interest and attract new participants.
Potential Scenarios and Future Outlook
Based on the current technical indicators and market sentiment, two primary scenarios emerge for PI in the near term:
-
Bearish Continuation: If PI fails to break above the $0.20 resistance and subsequently falls below the $0.15 support level, the bearish trend is likely to continue. This could lead to further price declines, with potential targets significantly lower than current levels. The vanishing volume, while initially suggesting a pause in selling, could also indicate a lack of strong buying interest to counteract any renewed selling pressure.
-
Bullish Reversal: For a bullish reversal to occur, PI needs to demonstrate strong buying conviction. A decisive move above $0.20, followed by a sustained push towards $0.28, would signal a potential shift in sentiment. This would require a significant influx of new capital and a positive catalyst, such as favorable news regarding the PI Network’s development, exchange listings, or broader market recovery. The RSI breaking above 50 and establishing higher highs would be a critical confirmation of this scenario.
Conclusion
The PI Network (PI) token is currently navigating a period of consolidation following a significant price correction. While the reduction in trading volume offers a glimmer of hope by indicating a potential lull in selling pressure, the sustained sideways movement around $0.18 presents a risk of further downside. Key technical levels at $0.15 (support) and $0.20/$0.28 (resistance) will be crucial in determining the short-term direction. The daily RSI remaining below 50 further emphasizes the prevailing bearish sentiment. Investors and observers will be closely monitoring the PI token for any signs of renewed buying interest or a decisive break above key resistance levels that could signal a potential trend reversal. The project’s ongoing development and eventual mainnet launch will undoubtedly play a significant role in shaping its long-term price trajectory.
SPECIAL OFFER (Exclusive)
Binance Free $600 (CryptoPotato Exclusive): Use this link to register a new account and receive $600 exclusive welcome offer on Binance (full details).
LIMITED OFFER for CryptoPotato readers at Bybit: Use this link to register and open a $500 FREE position on any coin!
Disclaimer: Information found on CryptoPotato is those of writers quoted. It does not represent the opinions of CryptoPotato on whether to buy, sell, or hold any investments. You are advised to conduct your own research before making any investment decisions. Use provided information at your own risk. See Disclaimer for more information.