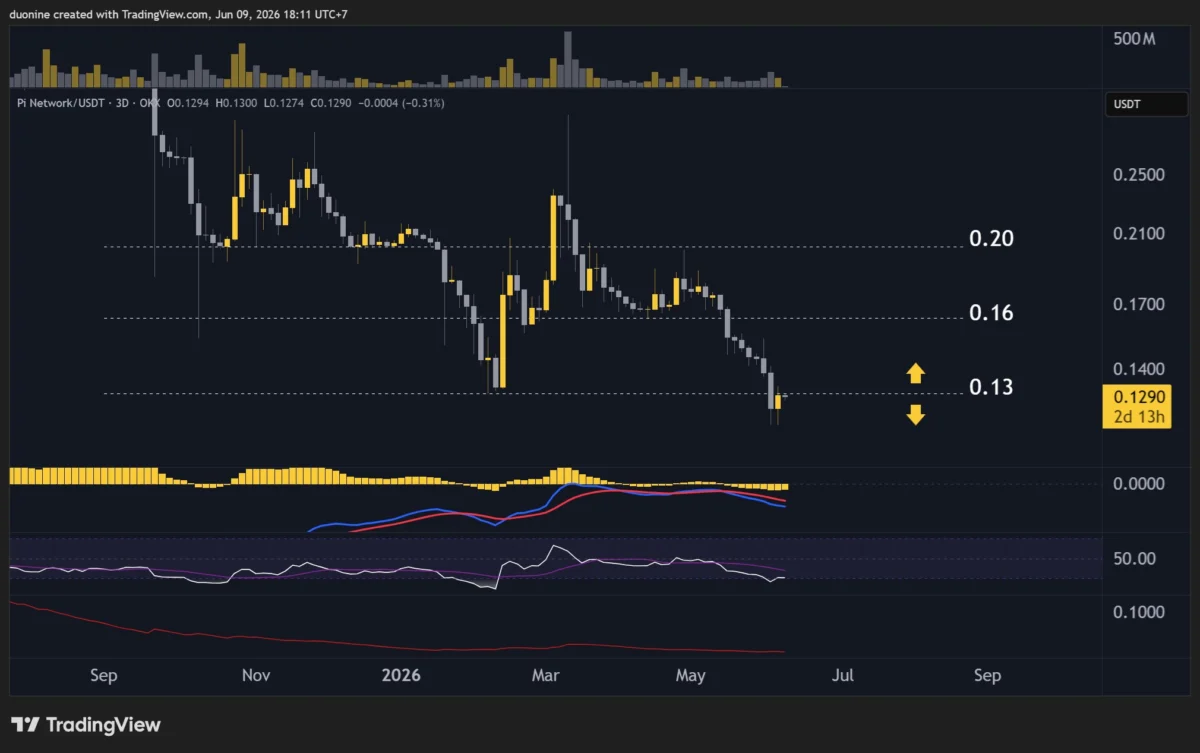
PI Network’s price has experienced a significant downturn, shedding another 10% this week and failing to maintain support at the $0.13 mark. This development signals a continuation of bearish sentiment, with key technical levels now defining the immediate future of the cryptocurrency. Analysts are closely monitoring the $0.10 level as a potential magnet for sellers, while resistance is now firmly established at $0.13 and $0.16.
PI Network (PI) Price Predictions: A Deep Dive into Technical Indicators
The recent price action for PI Network paints a concerning picture for its investors. After a period of consolidation and apparent hesitation, the cryptocurrency ultimately succumbed to selling pressure, breaking below the critical support level of $0.13. This level, previously a floor for the asset, has now flipped to become a significant resistance barrier. Technical analysts suggest that without a substantial shift in market dynamics, PI is likely to retest previous lows, with the $0.10 psychological and technical level appearing as the next logical target for downward momentum.
The implications of failing to reclaim the $0.13 mark are considerable. It suggests that the prevailing sentiment among traders is overwhelmingly bearish, and any attempts by buyers to initiate a recovery may face considerable headwinds. For PI to regain upward traction, a decisive break above $0.13 would be essential, signaling a potential reversal of the current downtrend. However, the current market environment, characterized by sustained selling pressure, makes such a scenario appear challenging in the short term.
Bearish Momentum Intensifies: Volume Profile and Seller Dominance
Further evidence of the intensifying bearish momentum can be observed in the volume profile. Data indicates a consistent pattern of selling activity with higher highs in volume since mid-May. This trend culminated in a significant price breakdown last week, with the cryptocurrency decisively falling below the $0.13 threshold. This sustained selling pressure suggests that a significant number of market participants are actively divesting their holdings, contributing to the downward pressure on PI’s price.
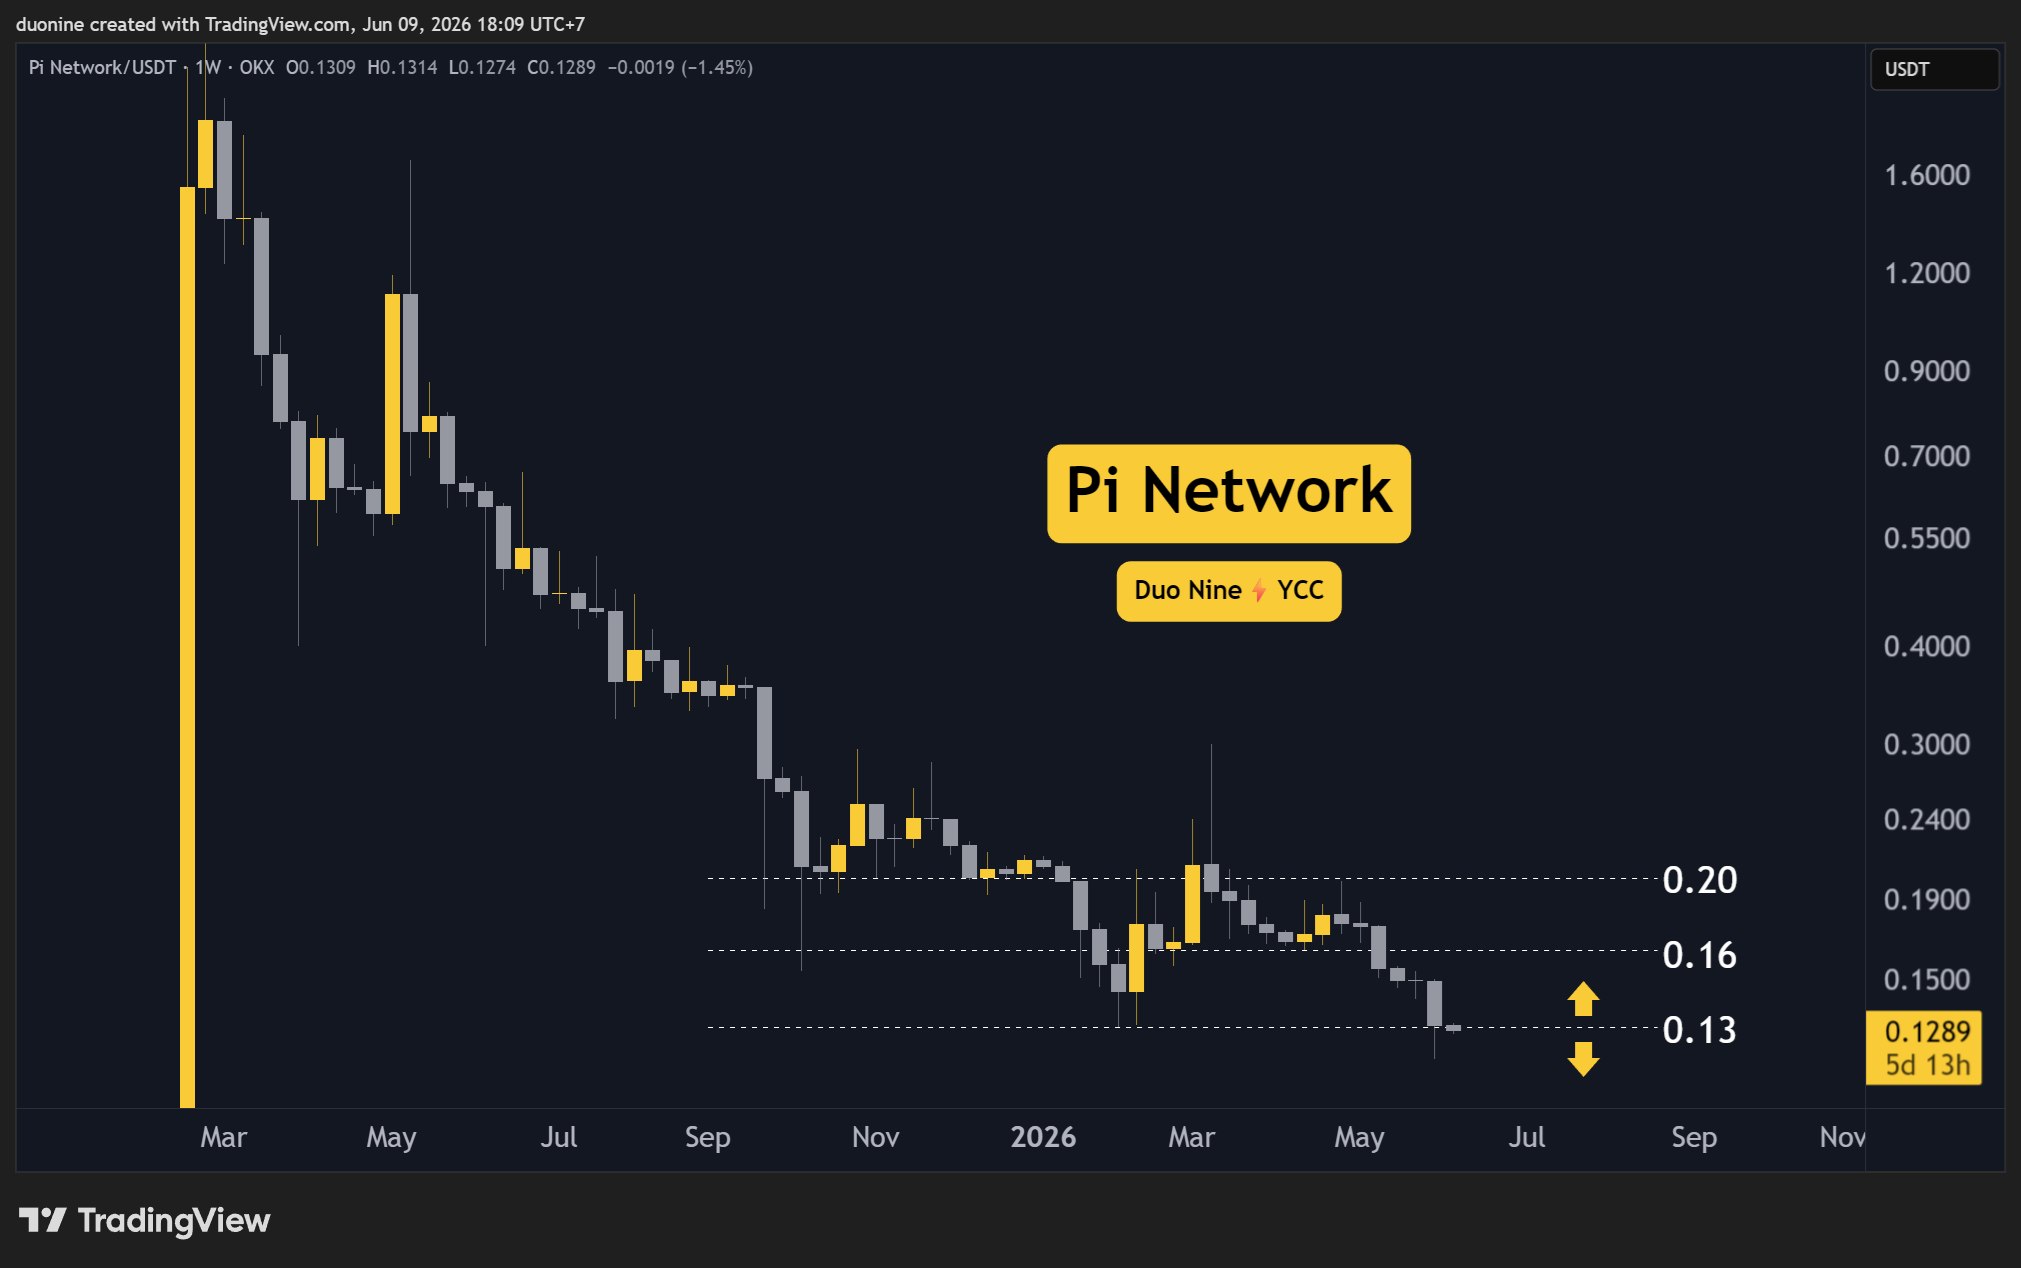
While there was a brief resurgence of buying interest earlier this week, it proved to be short-lived. Buyers managed to push the price back towards the $0.13 level, but were unable to sustain the momentum. At the time of this report, a fierce battle is underway between buyers and sellers at this crucial juncture. The outcome of this struggle will be instrumental in determining the immediate direction of PI’s price. A failure to break above this resistance could lead to further declines, while a successful reclamation could signal the beginning of a potential recovery.
The chart analysis, as depicted by TradingView data, visually corroborates these observations. The consistent formation of lower highs and lower lows on the price charts, coupled with increased selling volume during downward movements, reinforces the narrative of a dominant bearish trend. The retest of previous support levels that have now become resistance is a classic indicator of a weakening asset and the increasing conviction of sellers in the market.
Daily RSI Shows a Glimmer of Hope: Bullish Divergence Potential
Amidst the predominantly negative price action, a solitary positive signal has emerged from the daily Relative Strength Index (RSI). The daily RSI has registered a higher low in its recent movements. This technical formation is often interpreted as a potential bullish divergence. A bullish divergence occurs when the price of an asset makes lower lows, but its momentum indicator (in this case, the RSI) makes higher lows. This suggests that while selling pressure is still evident, the underlying momentum of the selling is weakening.
However, it is crucial to emphasize that this bullish divergence is merely a potential indicator and not a guarantee of an impending price reversal. For this divergence to materialize into a sustained recovery, PI Network would need to establish a solid bottom below the $0.13 mark and subsequently initiate a clear upward trend. Without this follow-through, the bullish divergence could prove to be a false signal, and the cryptocurrency could continue its descent.
The current scenario presents a complex trading environment. For potential buyers, the current price levels might appear attractive for accumulation, especially if the bullish divergence plays out. However, the overriding bearish sentiment and the proximity of the $0.10 support level suggest a cautious approach is warranted. Investors are advised to wait for more concrete signs of a sustained recovery before committing significant capital. The risk of further downside remains substantial, and a premature entry could lead to significant losses.
Background and Context: The PI Network Phenomenon
The PI Network has garnered significant attention within the cryptocurrency community, largely due to its unique approach to coin distribution. Launched with the promise of a mobile-first cryptocurrency mining experience, PI has cultivated a large user base that has been "mining" the cryptocurrency through their smartphones. This approach has positioned PI as a highly accessible digital asset, attracting individuals who might not otherwise have engaged with the broader cryptocurrency market.
However, the network has also faced scrutiny regarding its valuation and the timeline for its official launch and listing on major exchanges. The current price, hovering in the sub-$0.20 range, is significantly lower than some speculative valuations that have circulated within the community. The lack of a mainstream exchange listing and the ongoing development phase have contributed to the speculative nature of PI’s price discovery.
The recent price drop, therefore, can be viewed within this broader context. As the market matures and investor expectations are recalibrated, the price is finding its footing based on current trading dynamics rather than future potential alone. The breakdown below key technical levels suggests that the market is currently pricing in a more conservative outlook for PI, at least in the immediate term.
Broader Impact and Implications for the Crypto Market
The price action of PI Network, while specific to the asset, also reflects broader trends within the cryptocurrency market. The current environment is characterized by heightened volatility and a discerning investor base. Projects that lack clear utility, robust development roadmaps, and strong community engagement are facing increasing pressure.
For PI Network, the ability to translate its large user base into tangible real-world utility and a successful transition to a fully functional mainnet will be crucial for its long-term success. The current price correction, while painful for holders, could be an opportunity for the project to recalibrate its strategy and focus on fundamental development rather than speculative trading.
The implications of PI’s performance extend to the perception of mobile-based cryptocurrencies. A sustained downtrend could deter further development and investment in similar projects, while a successful recovery and eventual listing could reignite interest in this innovative sector of the crypto space. Investors and enthusiasts alike will be closely watching how PI Network navigates these challenging market conditions and whether it can ultimately deliver on its ambitious vision.
Key Support and Resistance Levels to Watch
As the market digests the recent price movements, traders and analysts are keenly focused on the following key technical levels:
- Key Support Level: $0.10. This level represents a significant psychological and historical support zone. A breach below this could trigger further substantial sell-offs.
- Key Resistance Levels: $0.13 and $0.16. The $0.13 level has now transitioned from support to resistance and is the immediate hurdle for any potential price recovery. The $0.16 level represents a more significant resistance point that would need to be overcome for a more robust uptrend to be established.
The interplay between these levels will dictate the short-to-medium term trajectory of PI Network’s price. A break below $0.10 could signal a prolonged bearish period, while a decisive move above $0.13, followed by consolidation above it, would be the first indication of a potential bullish shift. The coming days and weeks will be critical in determining which of these scenarios will unfold.
Disclaimer: The information provided in this article is for informational purposes only and does not constitute financial advice. Cryptocurrency investments are inherently volatile and carry a high degree of risk. Investors are advised to conduct their own thorough research and consult with a qualified financial advisor before making any investment decisions. The opinions expressed herein are those of the analysts and do not necessarily reflect the official policy or position of CryptoPotato.