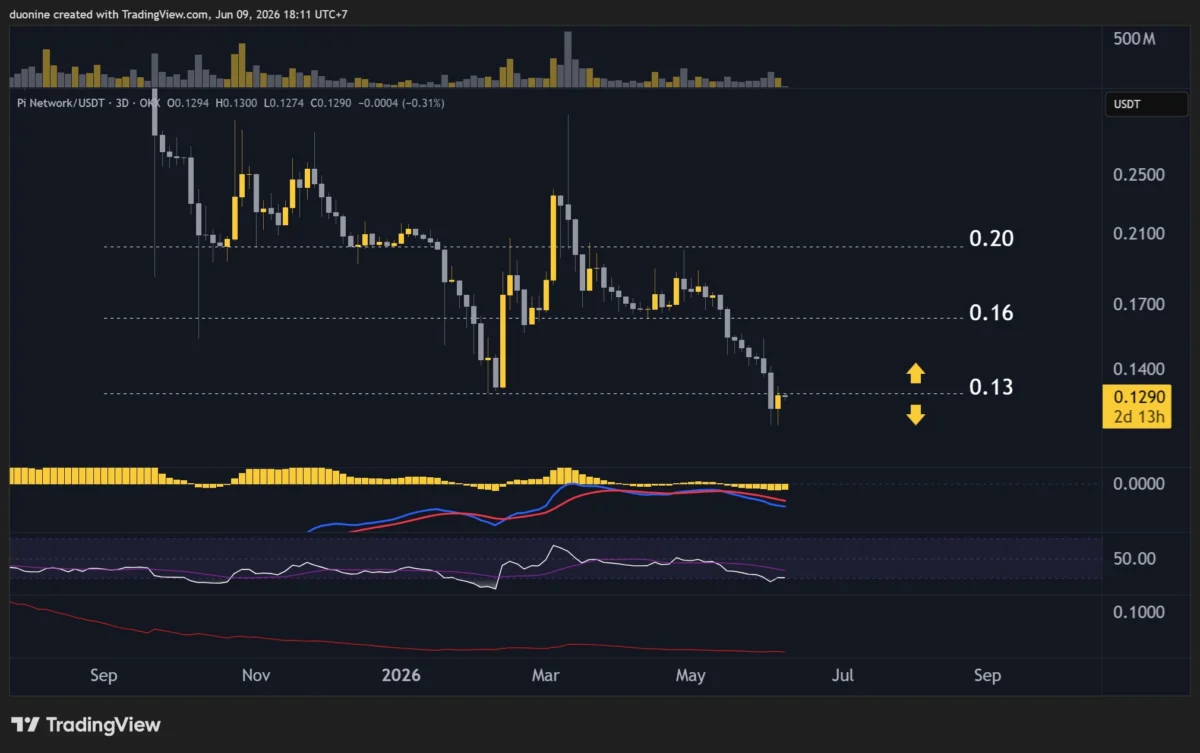
The cryptocurrency market has witnessed another significant downturn for PI Network (PI) this week, with the digital asset experiencing a sharp 10% decline. This considerable drop has resulted in PI losing its critical support level at $0.13, a development that has analysts closely watching the coin’s future trajectory. The breach of this key psychological and technical level signals intensified bearish momentum and raises concerns about further price erosion in the short term.
PI Network (PI) Price Predictions: Analysis
Technical indicators suggest that PI is currently navigating a challenging market environment. The identified key support level stands at $0.10, a significant psychological barrier that could act as a magnet for sellers if the current downtrend persists. Conversely, the immediate resistance levels are established at $0.13, which has now transitioned from support to a potential ceiling, and $0.16. The ability of PI to reclaim and hold above the $0.13 mark will be a crucial determinant of its short-term recovery prospects.
PI Network Loses Key Support, Facing Downward Pressure
After a period of hesitation and attempts to consolidate, PI Network has ultimately succumbed to selling pressure, falling below the $0.13 price point. This level, previously acting as a solid foundation for the asset, has now become a significant resistance. If prevailing market conditions and sentiment remain unchanged in the coming days, the cryptocurrency is poised to test new lows, potentially retesting or even breaching the $0.10 support.
The current market dynamics heavily favor sellers, with the $0.10 mark emerging as the most probable target. This level is expected to exert a gravitational pull on the price, making it an arduous task for buyers to initiate a sustainable recovery. The challenge for bullish investors will be to not only defend this lower support but, more importantly, to engineer a decisive reclaim of the $0.13 resistance. Failure to do so could signal a deeper correction.
Bearish Momentum Intensifies Amidst Sustained Selling
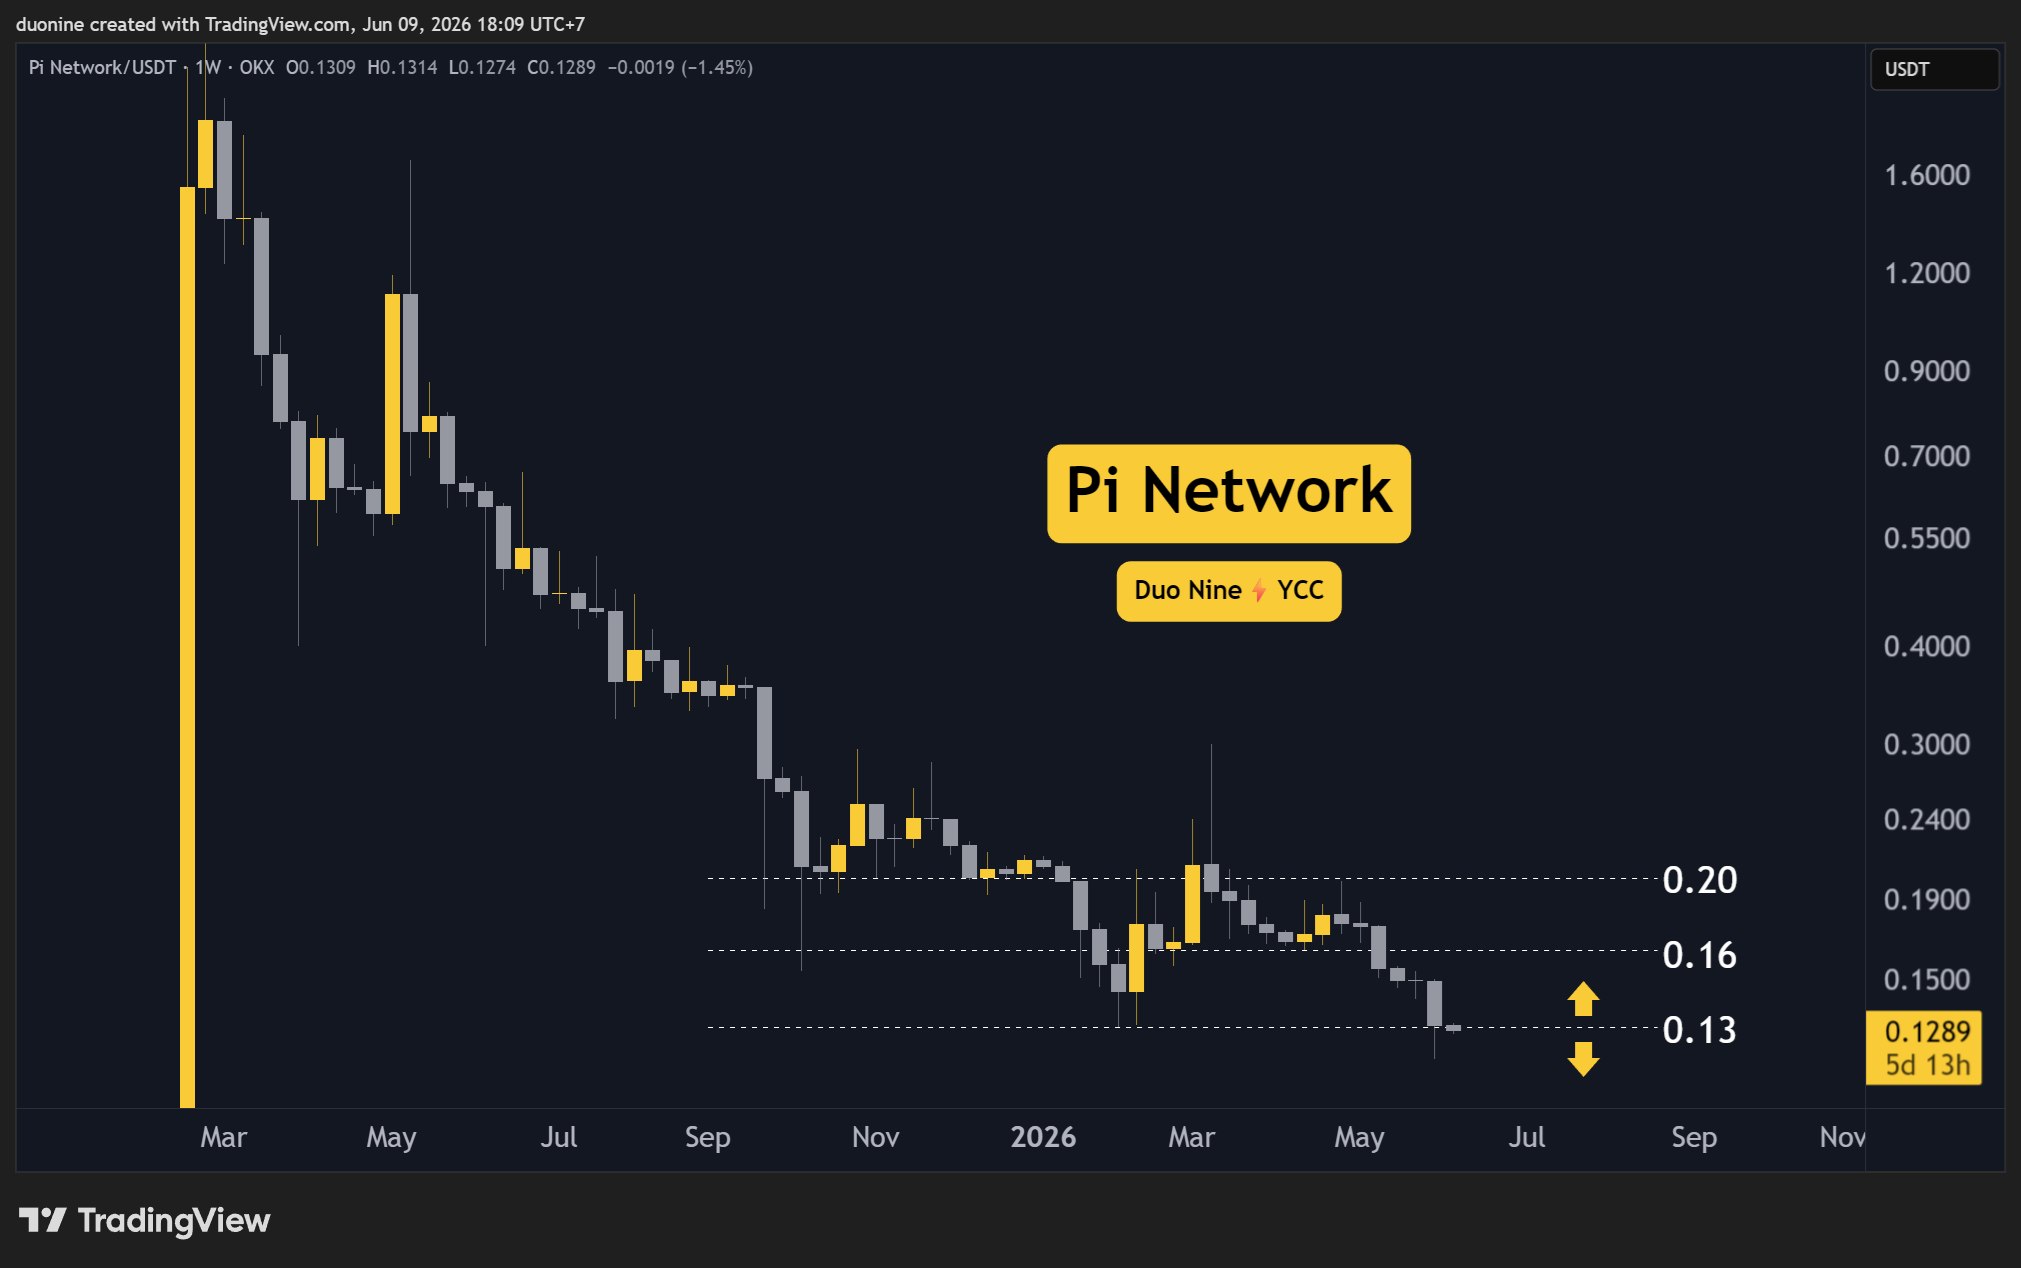
A closer examination of the volume profile reveals a concerning trend of sustained selling activity that has been building since mid-May. This persistent outflow has been characterized by higher highs in selling volume, indicating increasing conviction among bearish traders. The culmination of this pressure was observed last week when the price decisively broke below the $0.13 support.
While there was a brief resurgence of buying interest earlier this week, it proved to be short-lived. Buyers managed to push the price back towards the $0.13 level, but were ultimately unable to establish a firm hold. At the time of this report, the market is witnessing a fierce battle between bulls and bears at this pivotal price point. The outcome of this confrontation will likely dictate the immediate direction of PI’s price movement. A decisive victory for sellers could pave the way for a swift descent towards $0.10, while a successful defense and reclaim by buyers might initiate a short-term bounce.
Daily RSI Shows a Glimmer of Hope: Bullish Divergence on the Horizon?
Amidst the prevailing bearish sentiment, a singular technical indicator offers a sliver of optimism: the daily Relative Strength Index (RSI). The RSI has registered a higher low during this recent price decline, a phenomenon often interpreted as a bullish divergence. This divergence suggests that while the price has been making new lows, the underlying momentum may be weakening, potentially signaling an impending reversal.
However, for this bullish divergence to materialize into a tangible price recovery, PI Network will need to find a definitive bottom, likely below the $0.13 mark, and subsequently initiate a sustained upward trend. Until such a recovery is firmly established, the cryptocurrency is expected to remain within its current downtrend, with the possibility of further new lows looming. While these potential dips could present attractive entry points for opportunistic buyers, it is crucial to exercise caution. Without a clear recovery pattern, waiting for more definitive signals of a trend reversal may be a prudent strategy. The RSI, while showing potential, is not a guarantee of an immediate upturn and must be considered in conjunction with other market indicators and price action.
Background Context and Market Conditions
The PI Network project, which aims to enable users to mine PI coins through mobile phones, has garnered significant attention due to its unique approach to cryptocurrency accessibility. Launched with the promise of decentralization and user empowerment, the project has navigated a complex path, facing both enthusiastic adoption and scrutiny regarding its valuation and official exchange listings.
The current price action for PI occurs within a broader cryptocurrency market that has been characterized by volatility. Major cryptocurrencies like Bitcoin and Ethereum have also experienced significant price swings, influenced by macroeconomic factors, regulatory developments, and shifts in investor sentiment. The digital asset space, in general, remains susceptible to rapid changes, and projects like PI Network, which are still in developmental stages or have limited public trading history, can be particularly sensitive to market fluctuations.
The lack of widespread official exchange listings for PI has also been a point of discussion among investors and analysts. While the PI Network team has focused on building its ecosystem and user base, the absence of liquidity on major trading platforms can contribute to price volatility and make it more challenging to establish a definitive market valuation. This can lead to situations where the perceived value of PI is influenced by over-the-counter trades or unofficial markets, creating price discrepancies and adding to the uncertainty.
Timeline and Key Events
While specific dates for PI’s price movements are not always publicly highlighted in the same way as listed cryptocurrencies, the current analysis points to a recent period of intense selling pressure. The trend of sustained selling, marked by higher volume, appears to have been building over several weeks, accelerating in mid-May. The critical breach of the $0.13 support level is a recent event, likely occurring within the last week, leading to the current 10% drop observed this week.
The attempts by buyers to reclaim $0.13 represent a more immediate development, occurring within the past few days. The current consolidation and battle at this level are ongoing. The RSI divergence, as noted, is a consequence of the price action over the recent past, reflecting the pattern of lower price lows against a potentially stabilizing momentum indicator.
Supporting Data and Technical Indicators
The analysis relies on key technical indicators:
- Price Action: The direct observation of PI’s price movement, specifically the 10% weekly decline and the breach of the $0.13 support.
- Support and Resistance Levels: The identification of crucial price points ($0.13, $0.16 as resistance; $0.10 as support) that historically influence trading decisions.
- Volume Profile: The analysis of trading volume over time, revealing sustained selling pressure and spikes in volume during price declines.
- Relative Strength Index (RSI): A momentum oscillator that measures the speed and change of price movements. The observation of a higher low on the daily RSI indicates a potential bullish divergence.
The charts provided (though not directly accessible for interpretation here, their descriptions are key) would typically illustrate these points, showing candlestick patterns, volume bars, and the RSI indicator overlaid on the price chart, visually confirming the described trends and divergences.
Implications and Broader Impact
The continued decline in PI’s price, coupled with the loss of key support, has several implications:
- Investor Sentiment: This downturn is likely to negatively impact investor sentiment, potentially leading to further capitulation or a wait-and-see approach from potential new investors.
- Project Development: While the price action is a market phenomenon, sustained negative sentiment can indirectly affect a project’s perception and its ability to attract development talent and partnerships, especially if it relies on community funding or token appreciation for growth.
- Valuation Uncertainty: The lack of official listing and the current price trajectory contribute to the ongoing uncertainty surrounding PI Network’s true market valuation.
- Opportunity for Bargain Hunters: For those who believe in the long-term potential of PI Network, the current price drop might present an attractive entry point, provided they have a strong conviction and a long-term investment horizon. However, the risk of further decline remains significant.
Future Outlook and Analyst Perspectives
From a purely technical standpoint, the immediate future for PI Network appears challenging. The breakdown below $0.13 has shifted the market dynamics considerably. The $0.10 level is the next significant hurdle. Should this level fail to hold, the price could enter uncharted territory, making predictions more speculative.
The bullish divergence on the RSI offers a glimmer of hope, but it is crucial to remember that divergences are not infallible signals. They indicate potential, not certainty. A sustained recovery would require not only a reversal of selling pressure but also a fundamental shift in market sentiment and potentially positive developments from the PI Network project itself.
Market participants are advised to monitor the trading action around the $0.13 and $0.10 levels closely. A decisive move above $0.13 could signal a short-term relief rally, while a failure to hold $0.10 could lead to a more prolonged bear market for PI.
Disclaimer: The information presented in this article is based on technical analysis and market observation. It is intended for informational purposes only and does not constitute financial advice. Investing in cryptocurrencies involves significant risk, and investors are advised to conduct their own thorough research and consult with a qualified financial advisor before making any investment decisions. The PI Network project’s developmental status and market dynamics are subject to rapid change.