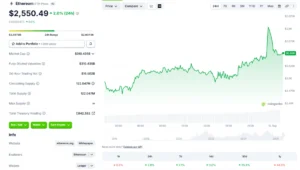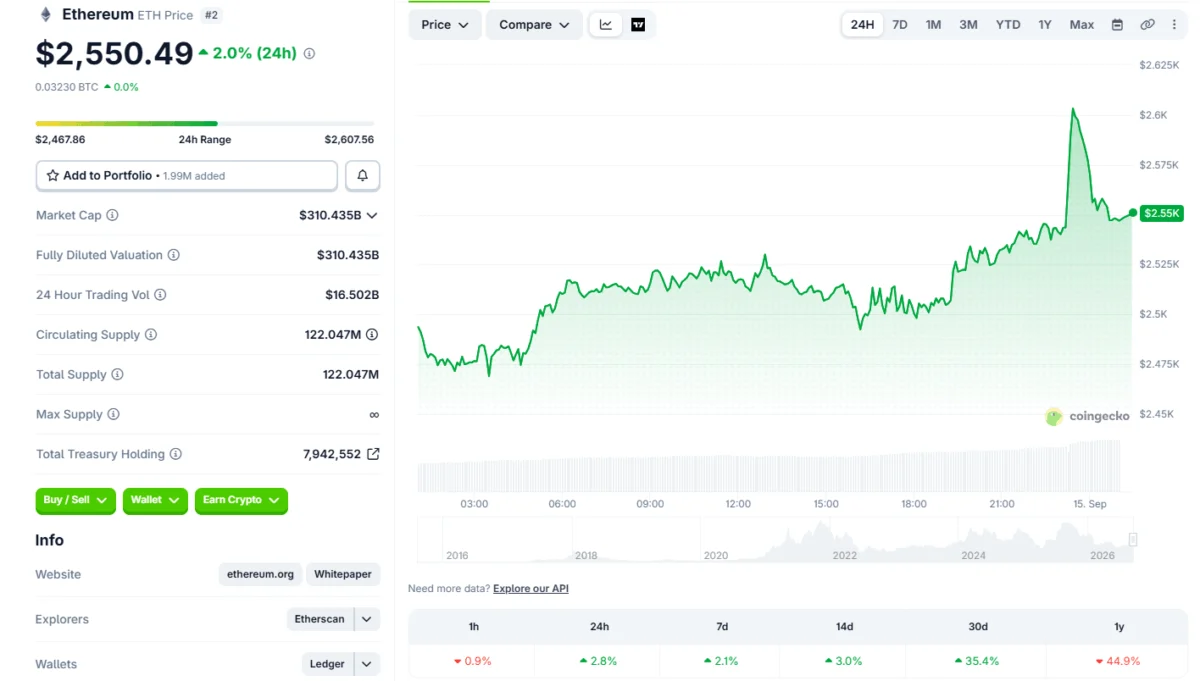
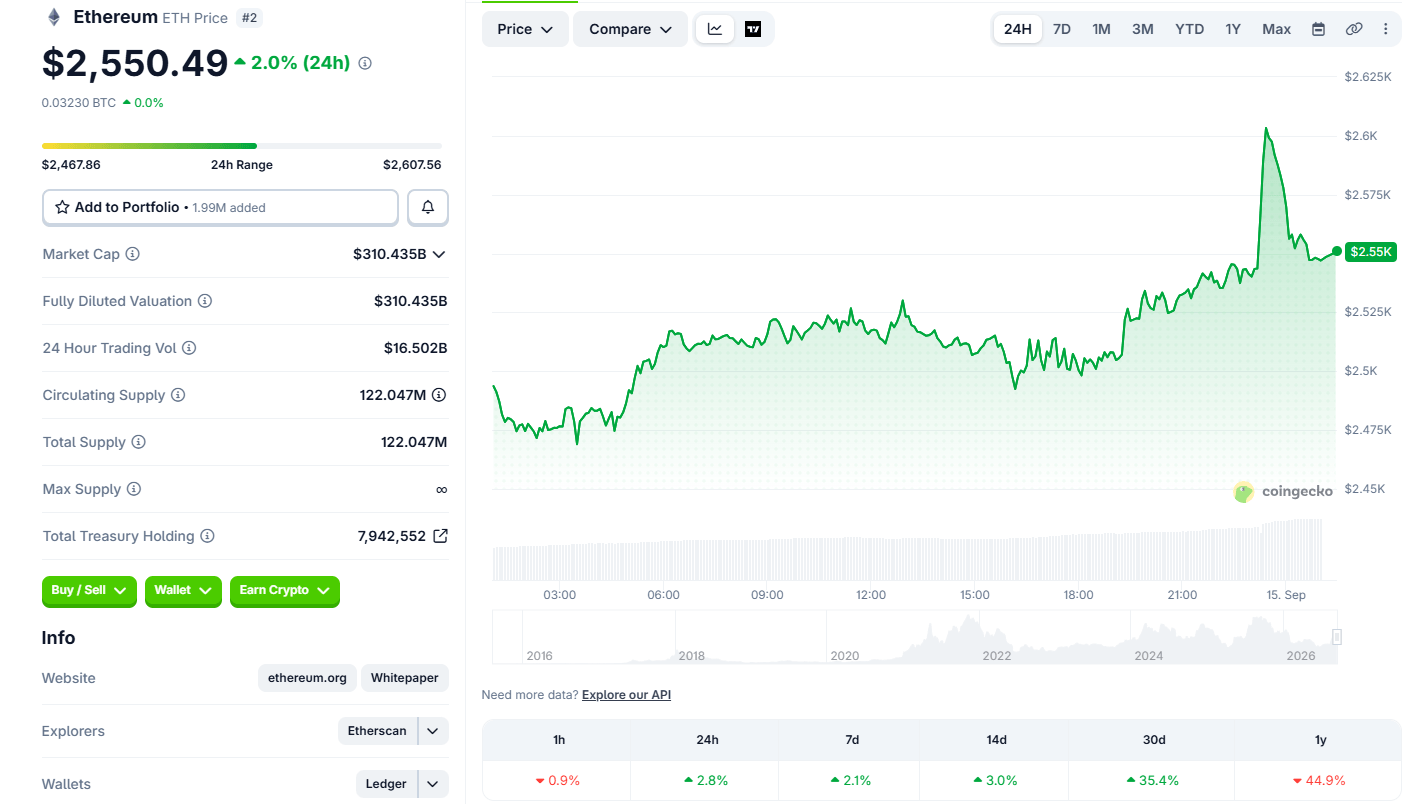
Ethereum (ETH), the second-largest cryptocurrency by market capitalization, is currently trading at $2,550.49, having posted a notable 1.86% gain over the past 24 hours and a 2.0% advance across the last seven days, according to current market data. This upward momentum is underpinned by a substantial 24-hour trading volume of $16.5 billion, reflecting sustained and active participation from market participants. The recent price action comes as leading crypto analysts highlight compelling technical patterns and significant on-chain indicators suggesting a potential breakout towards the $3,000 mark, a critical psychological and technical resistance level for the digital asset.
Ethereum’s Foundational Role and Market Significance
To fully appreciate the implications of Ethereum’s current market dynamics, it is crucial to understand its foundational role within the broader blockchain and cryptocurrency ecosystem. Launched in 2015, Ethereum pioneered the concept of a decentralized platform capable of executing "smart contracts" – self-executing contracts with the terms of the agreement directly written into code. This innovation paved the way for decentralized finance (DeFi), non-fungible tokens (NFTs), decentralized autonomous organizations (DAOs), and a vast array of other Web3 applications, collectively known as the Ethereum ecosystem. Its robust developer community, continuous innovation, and established network effect have solidified its position as a dominant force in the digital economy, often influencing the trajectory of the entire crypto market. The transition to Ethereum 2.0, or "The Merge," which shifted its consensus mechanism from Proof-of-Work (PoW) to Proof-of-Stake (PoS) in September 2022, dramatically reduced its energy consumption and set the stage for future scalability improvements, such as sharding. Subsequent upgrades, like the Dencun upgrade, further enhanced its efficiency and reduced transaction costs, making the network more attractive for users and developers alike.
Recent Market Dynamics and Price Action Chronology
The current positive performance of Ethereum follows a period of fluctuating sentiment across the broader cryptocurrency market. While Bitcoin often acts as the bellwether for the digital asset space, Ethereum’s independent developments and ecosystem growth frequently drive its distinct price movements. Over the past week, Ethereum has consistently maintained positive territory, resisting broader market pressures that might have caused corrections in less established assets. The $16.5 billion trading volume within 24 hours signifies robust liquidity and investor interest, indicating that the recent price gains are not merely due to low-volume fluctuations but are supported by active market participation. This sustained activity is a crucial factor for analysts assessing the validity and potential longevity of current trends. The price movement is not isolated but part of a larger narrative unfolding in the crypto space, where fundamental technological advancements and increasing institutional interest often converge with technical indicators to forecast future price action.
Technical Analysis: The Triangle Pattern Points to a Potential Breakout
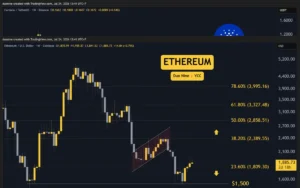
A significant driver of the current optimism surrounding Ethereum’s price is the identification of a specific technical chart pattern. Prominent chart analyst Ali Charts recently highlighted the formation of a "triangle pattern" on the Ethereum price chart. This pattern, characterized by converging trend lines, typically indicates a period of consolidation before a decisive price movement in either direction. According to Ali Charts, a similar triangle formation previously preceded a substantial 31% surge in Ethereum’s value within a mere three days, occurring after the pattern reached its completion. The emergence of a new, analogous triangle pattern is now drawing considerable attention from traders and investors.

In technical analysis, triangle patterns (symmetrical, ascending, or descending) are widely recognized as powerful indicators of potential breakouts. A confirmed breakout typically involves a forceful move above the pattern’s upper resistance boundary (for an ascending or symmetrical triangle) or below its lower support boundary (for a descending or symmetrical triangle), often accompanied by a significant increase in trading volume. The current analysis suggests that if Ethereum successfully breaks out of the identified pattern, a move towards the $3,000 target level is plausible. This target would represent an approximately 18% gain from its current trading price of $2,550.49.
Reaching and sustaining the $3,000 level is not just a numerical target but also holds significant psychological importance for market participants. Historically, round numbers like $1,000, $2,000, and $3,000 often act as strong psychological resistance or support levels, where a large volume of buy or sell orders tend to congregate. A decisive breakthrough of such a level, especially when supported by strong buying volume, can signal a shift in market sentiment and potentially trigger further upward momentum as short positions are covered and new long positions are initiated. Conversely, a failure to break out or a quick retrace after a false breakout could lead to a period of consolidation or even a downward correction. Therefore, traders will be closely monitoring the volume accompanying any potential breakout, as high volume provides validation for the strength and sustainability of the move.
On-Chain Metrics: Exchange Outflows Signal Reduced Selling Pressure
Adding another layer of bullish sentiment is the analysis of on-chain data, particularly concerning Ethereum’s supply on centralized exchanges. In a separate post, Ali Charts drew attention to a substantial outflow of Ethereum from exchange wallets. Over a period of 96 hours, approximately 140,000 ETH, valued at nearly $350 million, were withdrawn from exchanges. This significant volume of withdrawals suggests a clear behavioral shift among holders, indicating a preference for moving their assets into private, self-custodied wallets rather than keeping them readily available for trading on exchanges.
Exchange outflows are a critical on-chain metric often tracked by analysts to gauge investor sentiment and potential future selling pressure. When a large amount of cryptocurrency leaves exchanges, it typically implies that holders intend to retain their assets for the long term, reducing the immediate supply available for sale. This reduction in "liquid" supply on exchanges can, in turn, alleviate potential sell-side pressure and contribute to upward price momentum, assuming demand remains constant or increases. The observed pattern of outflows aligns with the 1.86% daily and 2.0% weekly gains, suggesting a direct correlation between reduced exchange supply and price appreciation.
Historically, sustained exchange outflows have often preceded or accompanied periods of significant price strength for cryptocurrencies. Investors moving assets off exchanges signal a conviction in the asset’s future value, opting for cold storage as a long-term investment strategy. This trend contrasts sharply with periods of high exchange inflows, which often precede or coincide with increased selling pressure and price corrections, as investors move assets to exchanges with the intent to sell. The current outflow trend, therefore, provides fundamental backing to the technical analysis, creating a confluence of signals that point towards a potentially bullish outlook for Ethereum. The $16.5 billion trading volume further confirms that despite the reduction in exchange supply, there is still ample market activity, indicating healthy demand dynamics.
Broader Market Context and Influencing Factors
Ethereum’s trajectory is not isolated but intertwined with the broader cryptocurrency market and global macroeconomic conditions. The performance of Bitcoin, which often acts as a benchmark, significantly influences altcoins like Ethereum. A bullish trend in Bitcoin typically creates a positive halo effect across the market, drawing new capital and boosting investor confidence. Conversely, a significant correction in Bitcoin can drag down the entire market. Beyond Bitcoin, the increasing institutional adoption of cryptocurrencies, particularly through spot Ethereum Exchange-Traded Funds (ETFs) in various jurisdictions, could unlock significant capital inflows. While spot Ethereum ETFs in the United States are still under regulatory review, progress in this area could dramatically alter market dynamics by providing traditional investors with a regulated and accessible avenue to gain exposure to ETH.
Regulatory developments also play a crucial role. Clarity or favorable rulings from regulatory bodies worldwide could bolster investor confidence and reduce perceived risks associated with digital assets. Conversely, unfavorable regulations or increased scrutiny could dampen market enthusiasm. Furthermore, the global macroeconomic environment, including interest rates, inflation, and geopolitical events, can influence risk appetite. In times of economic uncertainty, investors may shy away from riskier assets like cryptocurrencies, while a more stable or growth-oriented economic outlook could encourage investment. Ethereum’s robust ecosystem, however, provides a degree of resilience, as its utility in DeFi, NFTs, and other applications continues to drive demand regardless of some external factors. The ongoing innovation within the Ethereum network, including advancements in Layer 2 scaling solutions, further enhances its long-term value proposition and utility.
Risk Factors and Market Volatility
Despite the converging bullish signals, it is imperative to acknowledge the inherent volatility and risks associated with the cryptocurrency market. Technical patterns, while powerful, are not infallible, and market conditions can change rapidly. A confirmed breakout above resistance would need to hold, and any retesting of previous resistance levels as support would be closely watched. A failure to sustain the breakout, or a "false breakout," could lead to disappointment and a swift reversal of gains. External market shocks, unexpected regulatory announcements, or a significant shift in investor sentiment in the broader financial markets could also impact Ethereum’s price trajectory.
Moreover, while exchange outflows indicate reduced selling pressure, they do not eliminate it entirely. A sudden change in long-term holder sentiment, perhaps triggered by a major security exploit or a significant network issue, could lead to a reversal of these trends. The $3,000 target, while supported by current analysis, remains a projection, and market participants should exercise caution and conduct their own due diligence. Price predictions in the volatile crypto space are subject to numerous variables and can often be influenced by market psychology and speculative trading.
Implications for Investors and the Ethereum Ecosystem
A successful breakout towards $3,000 would have significant implications for various stakeholders within the Ethereum ecosystem. For investors, it would represent a validation of the current bullish sentiment and potentially open the door for further price appreciation towards higher resistance levels. Long-term holders, who have been accumulating off-exchange, would see their conviction rewarded. For the broader Ethereum ecosystem, a higher ETH price often translates to increased capital inflows into DeFi protocols, more liquidity for NFT markets, and greater funding for Web3 development projects built on the network. A more valuable native asset can also enhance the network’s security (in a PoS system) and attract more developers and users. This positive feedback loop can further entrench Ethereum’s position as a leading smart contract platform. The enhanced market capitalization that would accompany a move to $3,000 would also solidify Ethereum’s standing among global financial assets, potentially attracting even more institutional interest and mainstream attention.
Conclusion and Outlook
Ethereum’s recent performance, characterized by consistent gains and substantial trading volume, is supported by a compelling confluence of technical and on-chain indicators. The identification of a bullish triangle pattern by analysts, coupled with significant outflows of ETH from exchanges, paints a picture of reduced selling pressure and growing investor confidence. These factors collectively suggest a strong potential for Ethereum to break out towards the $3,000 mark in the near to medium term. While the cryptocurrency market remains inherently volatile and subject to various external influences, the current data points offer a robust foundation for an optimistic outlook. Market participants will undoubtedly be monitoring key resistance levels, trading volumes, and broader market sentiment as Ethereum navigates this potentially pivotal phase, with the $3,000 threshold standing as a critical benchmark for its immediate future trajectory.