
The cryptocurrency market has experienced a significant downturn this week, with PI Network’s native token, PI, plummeting by a notable 10%. This sharp decline has brought the digital asset to a critical support level, raising questions about its ability to withstand further selling pressure. Analysts are closely monitoring the price action around the $0.13 mark, a level that has historically shown buying interest, but the prevailing bearish sentiment and increasing selling volume present a formidable challenge.
Market Correction Sends PI to Crucial Support Levels
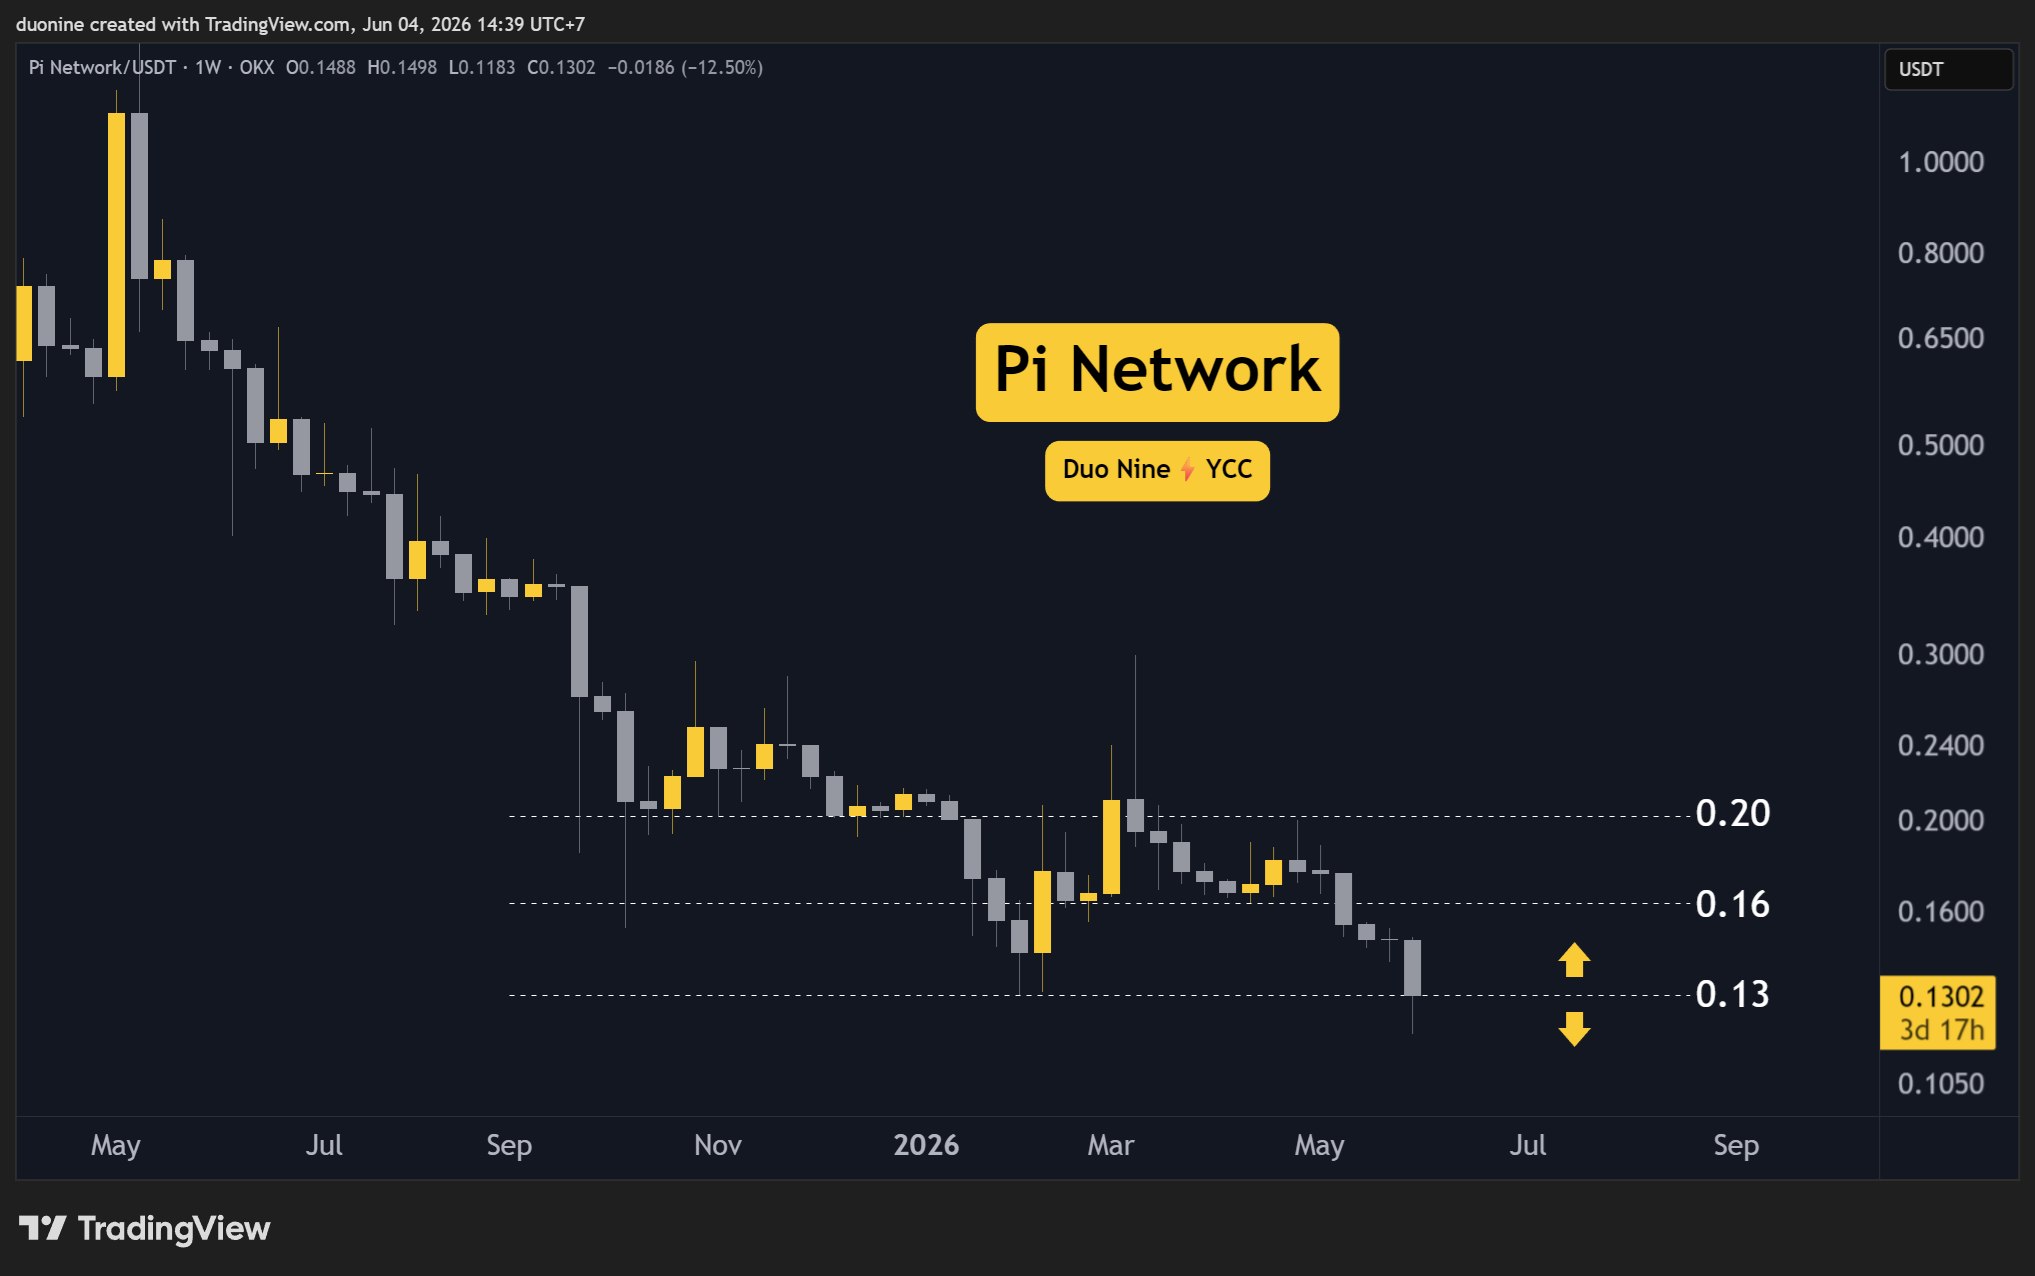
In the wake of a broader market correction, PI experienced a steep 10% drop, reaching a new weekly low. This price action has brought the cryptocurrency to the $0.13 key support level. While initial signs suggest buyers are re-entering the market at this price point, the overall outlook remains decidedly bearish. This pessimism is fueled by a discernible increase in selling volume over the past few trading days, indicating that sellers are actively seeking to liquidate their positions.
The formation of a lower low in PI’s price chart is a significant bearish indicator, reinforcing the existing downtrend. Should the current support at $0.13 fail to hold and subsequently transform into resistance, the downward trajectory is likely to accelerate, potentially leading to further declines. This scenario would mark a critical turning point, suggesting that the bears have gained decisive control of the market for PI.
Key Technical Levels Under Scrutiny
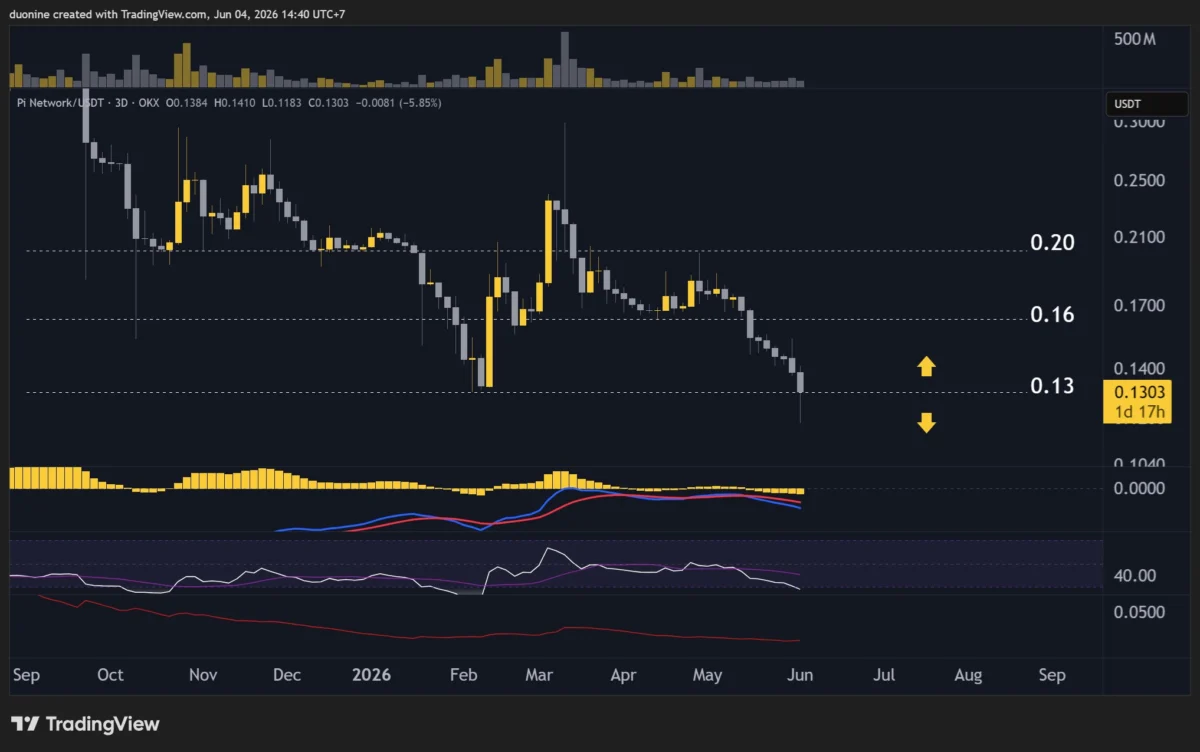
Technical analysis reveals specific price levels that are crucial for understanding PI’s potential future movements. The identified key support levels are situated at $0.13 and $0.10. These are the price points where buying pressure has historically emerged, potentially halting or reversing a downtrend. Conversely, key resistance levels are noted at $0.16 and $0.20. These are the price ceilings that PI would need to overcome to signal a potential shift in market sentiment towards bullishness.
Aggressive Selling Dominates the Recent Trading Period
On the 3-day timeframe, a clear pattern of seller dominance has been observed. For eight consecutive trading candles, sellers have exerted significant control, pushing the price of PI down by approximately 30%. This aggressive selloff commenced immediately after the support level at $0.16 proved insufficient to contain the selling pressure.
The failure of the $0.16 support was a pivotal moment, signaling a loss of bullish momentum and opening the door for further depreciation. If the $0.13 support level, currently being tested, also succumbs and transforms into a resistance zone, a similar, perhaps even more pronounced, pattern of accelerated decline could emerge. In such a bearish scenario, the next significant price target for sellers would be the $0.10 support level.
Deeper Dive into Market Dynamics and Technical Indicators
The current market environment for PI is characterized by a pronounced bearish trend, evidenced by the consistent lower lows and lower highs observed in its price chart. The 10% weekly decline is not an isolated event but rather a continuation of a broader sell-off that has seen PI lose substantial value over recent periods.
The failure of the $0.16 support level was a critical technical event. Historically, this level may have represented a consolidation zone or a point of significant buying interest. Its breach suggests that market participants who were holding PI at or above this level were forced to exit their positions, either due to stop-loss orders being triggered or a general capitulation. This increased selling pressure then cascaded down to the next significant support at $0.13.
The increased selling volume accompanying the price drop is a strong confirmation of the bearish sentiment. High volume during a price decline typically indicates conviction among sellers, suggesting that the downward momentum is likely to persist until significant buying interest emerges to absorb the supply.
The Role of the Relative Strength Index (RSI)
The daily Relative Strength Index (RSI) provides further insight into the current market conditions. The recent price plunge has pushed the daily RSI into oversold territory, a reading typically below 30 points. As of the latest data, the RSI is hovering around the 25-point mark. Critically, there are no immediate signs of a reversal on the RSI, suggesting that the oversold conditions could persist, and even lower readings might be possible in the short term.
However, it is important to note that an oversold RSI does not inherently predict an immediate price bounce. Instead, it signals that the asset has experienced a rapid and significant decline, and that sellers might be becoming overly aggressive. This situation can, paradoxically, increase the probability of a future bounce or relief rally. When an asset becomes deeply oversold, the potential for a short-term upward correction intensifies, as profit-taking by short-sellers or opportunistic buying could emerge.
Implications for Investors and Future Price Trajectories
The current technical setup for PI Network presents a precarious situation. The key question for investors and market observers is whether the $0.13 support level can hold. If it does, it could provide a much-needed reprieve for the token, potentially sparking a short-term bounce. A successful defense of this level could see PI retesting the $0.16 resistance.
Conversely, a decisive break below $0.13 would be a significant bearish development. This would not only confirm the continuation of the downtrend but also open up the path towards the next major support at $0.10. Such a move would likely be accompanied by increased volatility and further negative sentiment surrounding the PI Network.
The increasing selling volume, coupled with the oversold RSI, creates a complex dynamic. While the oversold RSI suggests a potential for a rebound, the persistent selling pressure indicates that bears are still in control. Therefore, careful observation of price action at the $0.13 level is paramount. Any sustained buying pressure and a subsequent upward price movement from this level would be a crucial signal for potential buyers.
Broader Context and Potential Contributing Factors
While the provided analysis focuses on technical indicators, it is also important to consider the broader market context and any fundamental developments that might be influencing PI’s price. The cryptocurrency market is inherently volatile and susceptible to macroeconomic factors, regulatory news, and shifts in investor sentiment.
The current downturn could be influenced by a variety of factors, including:
- Global Economic Uncertainty: Rising inflation, interest rate hikes by central banks, and geopolitical tensions can lead investors to de-risk their portfolios, often impacting speculative assets like cryptocurrencies.
- Regulatory Scrutiny: Increased attention from regulatory bodies worldwide can create uncertainty and apprehension within the crypto space, leading to sell-offs.
- Market-Wide Sentiment: When the broader cryptocurrency market experiences a significant correction, even fundamentally strong projects can be pulled down by the prevailing negative sentiment.
- Specific PI Network Developments: While not detailed in the provided text, any perceived slowdown in development, delays in key milestones, or negative news specific to the PI Network project could also contribute to selling pressure.
Understanding these broader influences can provide a more comprehensive picture of the forces driving PI’s price action.
The Path Forward: Key Scenarios to Watch
The coming days and weeks will be critical for PI Network. The market will be keenly observing whether the $0.13 support level can absorb the selling pressure.
Scenario 1: Support Holds and a Bounce Occurs
If PI finds strong buying interest at $0.13 and begins to move upwards, the immediate target would be to reclaim the $0.16 resistance level. A sustained move above $0.16 could then pave the way for testing the $0.20 resistance. This scenario would suggest that the recent downturn was a temporary correction within a larger upward trend or a healthy consolidation phase.
Scenario 2: Support Breaks and Further Decline Ensues
If the selling pressure overwhelms the $0.13 support, PI could experience a rapid descent towards the $0.10 level. Breaking through $0.10 would signal a continuation of the strong bearish trend, potentially leading to further significant price drops. In this scenario, the market would need to find a new, more substantial support level to arrest the decline.
Scenario 3: Consolidation and Uncertainty
It is also possible that PI enters a period of consolidation around the $0.13 level. This would involve a period of choppy trading with neither buyers nor sellers gaining a clear advantage. Such a phase could precede a more decisive move in either direction, depending on market developments and evolving investor sentiment.
Conclusion
PI Network’s price is currently at a critical juncture, facing significant downward pressure and testing a key support level at $0.13. The recent 10% weekly decline, coupled with increasing selling volume and an oversold RSI, paints a bearish picture in the short term. However, the oversold conditions also suggest that a bounce is plausible. The ability of the $0.13 support to hold will be the determining factor in PI’s immediate future. Investors are advised to monitor price action closely, paying particular attention to trading volumes and the behavior of the RSI, as these indicators will provide crucial clues about the market’s next move. The failure of this support could signal a deeper descent towards $0.10, while its successful defense might offer a temporary respite and an opportunity for a short-term recovery.