The cryptocurrency market has spent the majority of the current cycle defined by a singular, overwhelming trend: the absolute dominance of Bitcoin. For investors holding a diversified portfolio of digital assets, the experience has been one of prolonged frustration. Throughout 2023 and 2024, the widely anticipated "rotation"—a mechanical shift where profits from Bitcoin flow into the broader altcoin market—repeatedly failed to materialize in a sustainable way. While Bitcoin achieved new all-time highs and captured the lion’s share of institutional inflows via spot Exchange-Traded Funds (ETFs), the majority of altcoins remained trapped in a cycle of lackluster price action, declining against their Bitcoin pairs, and failing to recapture the retail mania seen in previous cycles. However, fresh on-chain data and technical analysis now suggest that the structural foundations of this Bitcoin-centric regime are beginning to weaken, paving the way for a potential resurgence in the broader altcoin ecosystem.
Recent analysis from CryptoQuant, a leading provider of on-chain and exchange data, has identified a significant shift in trading volume that distinguishes current market behavior from the "noise" of the past eighteen months. By tracking volume across centralized exchanges and specifically excluding the top five crypto assets, analysts have observed a clear, accelerating trend in broad-based participation. This increase in volume across the mid-cap and small-cap sectors is often the first precursor to a genuine market rotation. Unlike isolated pumps in specific "meme" tokens or a handful of high-profile assets, this data suggests a rising tide that is beginning to lift the wider market, indicating that capital is finally seeking opportunities outside the safety of the industry’s largest players.
The Metrics of Change: Understanding the AltSeason Index
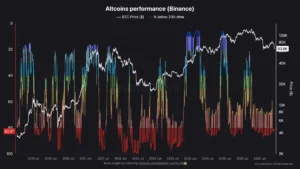
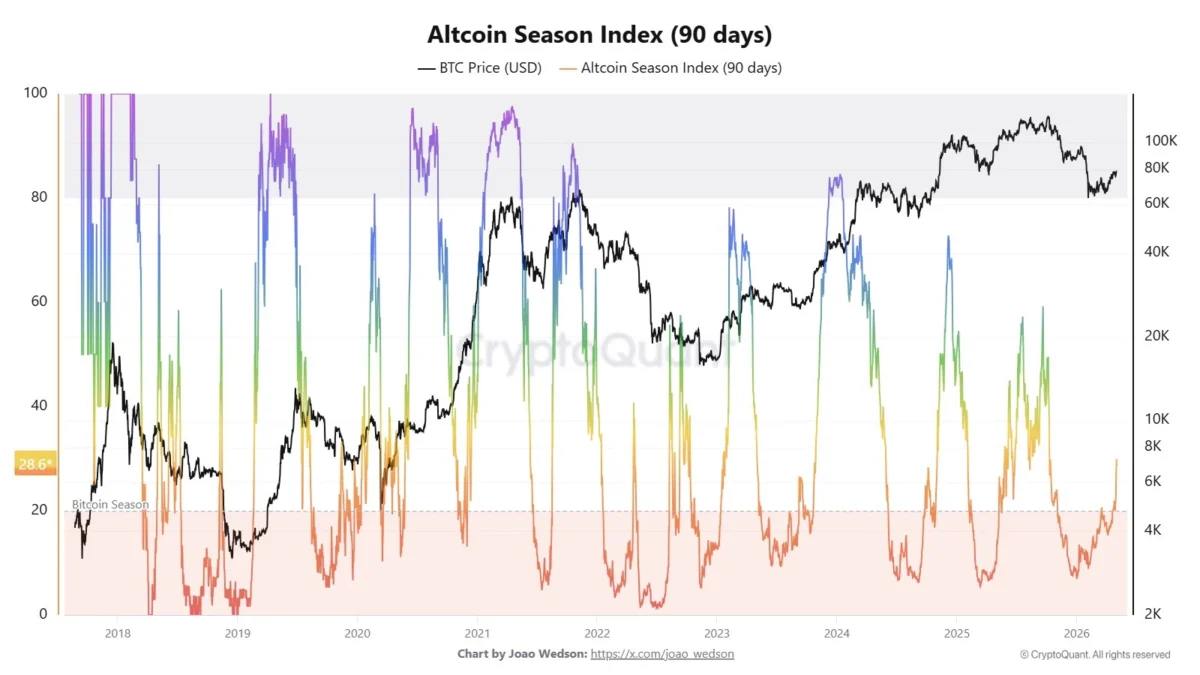
Central to this burgeoning narrative is the 90-day AltSeason Index, a metric designed to track whether the top 50 altcoins are outperforming Bitcoin over a rolling three-month window. For much of the current cycle, this index remained at suppressed levels, often languishing in the single digits or low teens, signaling a definitive "Bitcoin Season." Recently, however, the index has surged to 28.6. While a reading of 75 or higher is typically required to declare a full-blown "Altseason," the velocity and direction of the current move are more important than the absolute number.

The rise to 28.6 indicates that the behavioral shift seen in volume data is now being reflected in price performance. The transition from a Bitcoin-led market to an altcoin-led market rarely happens overnight; it is a process of "churn" where Bitcoin’s volatility stabilizes, and its dominance percentage begins to plateau. According to the CryptoQuant report, the current signals suggest that the period of absolute Bitcoin dominance is entering its twilight phase. What replaces it could be the period of catch-up that altcoin holders have anticipated since the market bottomed in late 2022.
A Chronology of Disappointment: Why 2024 Failed to Deliver
To understand the significance of the current signal, one must examine the timeline of the current market cycle and why previous "false starts" occurred.
In late 2023, the market began to price in the approval of spot Bitcoin ETFs in the United States. This created a massive supply-demand imbalance that favored Bitcoin exclusively. When the ETFs were finally approved in January 2024, the resulting institutional demand drove Bitcoin to new heights, but this capital stayed within the "walled garden" of regulated financial products. Unlike retail investors who might buy Bitcoin on a centralized exchange and then "swap" it for Ethereum or Solana, institutional ETF buyers do not have the mechanism or the mandate to rotate into unapproved altcoins.
By March 2024, the AltSeason Index saw a modest peak, leading many to believe the rotation had arrived. However, this move was short-lived. The "altseason that never was" left a trail of unmet expectations. Throughout the summer and autumn of 2024, Bitcoin continued to absorb the majority of market liquidity, while altcoins suffered from "dilution" as hundreds of new projects launched, spreading the remaining retail capital too thin. This extended period of underperformance has created a massive reservoir of pent-up rotation capital. Historically, the longer the period of Bitcoin dominance, the more explosive the eventual rotation tends to be, as market participants seek higher-beta returns to compensate for the time spent in stagnant assets.

The Ethereum Factor: A Nine-Year Technical Convergence
No discussion of an altseason is complete without an analysis of Ethereum (ETH). As the second-largest cryptocurrency and the primary platform for decentralized finance (DeFi) and Non-Fungible Tokens (NFTs), Ethereum acts as the "gateway" for liquidity entering the broader altcoin market. If Bitcoin is the reserve currency of the crypto world, Ethereum is its primary engine of commerce.
The CryptoQuant report highlights a particularly rare technical setup for Ethereum: a nine-year technical convergence. This refers to a massive structural wedge or triangle formation that has been developing since the asset’s early years. Such long-term patterns are highly significant in technical analysis, as they represent a multi-year battle between buyers and sellers that is finally reaching a resolution point.
The analysis suggests that Ethereum is positioned for a meaningful move higher as it nears the apex of this convergence. Historically, when Ethereum begins to outperform Bitcoin (the ETH/BTC ratio), it provides the "green light" for the rest of the market. Because so many altcoins are paired against Ethereum in decentralized liquidity pools, a rise in ETH price mechanically increases the value of the entire ecosystem. The technical setup currently visible has not been seen in nearly a decade, suggesting that the upcoming move could be structural rather than merely cyclical.
Technical Analysis: The "OTHERS" Index and Key Inflection Zones
Beyond individual assets, the total market capitalization of all cryptocurrencies excluding the top 10—often referred to by the ticker "OTHERS"—provides a bird’s-eye view of the altcoin market’s health. Currently, this index is attempting to stabilize within the $190 billion to $200 billion range. This is a critical psychological and technical "inflection zone."

From a structural perspective, the "OTHERS" chart has transitioned from a period of distribution (where large holders sell to retail) into a potential accumulation zone. Key technical indicators support this view:
- The 200-Week Moving Average: This long-term average is currently acting as a "floor." In previous cycles, the 200-week moving average has served as the ultimate pivot point, marking the transition from a bear market to a sustainable bull market. The fact that altcoins are holding this level suggests that the "bottom is in" for the broader market.
- The 50-Week and 100-Week Moving Averages: The 100-week moving average (represented in green on many charts) is currently acting as dynamic resistance. While the 50-week average (blue) has begun to curl upward—indicating that downside momentum is fading—the market remains in a neutral-to-bullish transition. A clean break and hold above the $220 billion to $240 billion region would confirm a "higher high," providing the technical confirmation needed to attract trend-following investors.
- Volume Nuance: Interestingly, the recovery from the lows of early 2025 has not been driven by aggressive "FOMO" (Fear Of Missing Out) buying, but rather by a significant reduction in selling pressure. This "exhaustion" of sellers is often a more stable foundation for a rally than a speculative spike in buying, as it suggests that weak hands have been flushed out of the market.
Broader Implications and Market Outlook
If the data from CryptoQuant and the technical setups in Ethereum and the "OTHERS" index hold true, the implications for the digital asset industry are profound. A genuine altseason would likely see a resurgence in DeFi activity, as rising token prices increase the Total Value Locked (TVL) in various protocols, creating a feedback loop of utility and value. It would also likely spark renewed interest in sectors that have been dormant, such as Layer 2 scaling solutions, Artificial Intelligence (AI) integrated tokens, and Real World Asset (RWA) tokenization.
However, analysts warn that the "new" altseason may look different from the ones seen in 2017 or 2021. With thousands of tokens now in existence, the market is becoming increasingly fragmented. A "rising tide" may no longer lift all boats equally. Instead, investors may see a "sector-rotation" style altseason, where high-quality projects with actual revenue and user growth outperform speculative assets.
In conclusion, while the patience of altcoin investors has been tested by an unprecedented period of Bitcoin dominance, the underlying data suggests a regime shift is underway. The combination of rising altcoin exchange volume, a climbing AltSeason Index, and a historic technical setup for Ethereum points toward a market that is ready to redistribute liquidity. Whether this becomes the definitive altseason of the cycle remains to be seen, but for the first time in years, the data is beginning to align with the expectations of the broader market. The key levels to watch remain the $220 billion mark for the "OTHERS" index and the resolution of Ethereum’s multi-year convergence. Failure to hold the $190 billion support zone would likely invalidate the current bullish thesis, potentially reopening a test of the $160 billion lows and extending the "Bitcoin winter" for altcoin holders.