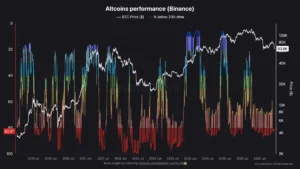
The cryptocurrency market is witnessing a significant structural shift in liquidity as altcoins have officially claimed a majority share of the trading volume on Binance, the world’s largest digital asset exchange. For the first time in the current market cycle, altcoins—excluding Bitcoin and Ethereum—now account for 51% of the platform’s total trading activity. This milestone marks a dramatic departure from the previous three years of relative stagnation for the broader altcoin sector, which has struggled to regain its footing since the devastating bear market of 2022. As Bitcoin enters a period of range-bound price action, investors appear to be aggressively reallocating capital into higher-beta assets in anticipation of a broader market recovery.
The transition toward altcoin dominance on Binance has been rapid. According to data analyzed by market expert Darkfost, the share of altcoin trading volume sat at a mere 31% as recently as early March. During that period, market participants were heavily concentrated in Bitcoin (BTC) and Ethereum (ETH), seeking the perceived safety of the industry’s two largest assets amid heightened macro uncertainty and the launch of spot Bitcoin ETFs in the United States. However, in a span of just six weeks, the altcoin share has surged by 20 percentage points, signaling a profound change in trader behavior and risk appetite.
The Dynamics of Liquidity Rotation
In the zero-sum environment of exchange liquidity, the growth of one sector necessitates the contraction of others. As altcoins ascended to their 51% share, both Bitcoin and Ethereum experienced notable declines in their respective volume distributions. Bitcoin’s share of Binance trading activity currently stands at 30%, while Ethereum has seen its share retreat to 17%. The decline in Ethereum’s dominance is particularly striking given its proximity to recent highs; as of April 11, Ethereum still commanded 27% of the platform’s volume. The fact that it has shed 10 percentage points of its market share in less than a fortnight suggests a deliberate and accelerated exit from ETH into more speculative, smaller-cap assets.

Analysts suggest that this rotation is a byproduct of the current "consolidation phase." When Bitcoin trades within a tight horizontal range, it often fails to provide the volatility required for short-term speculators to generate significant returns. Consequently, capital begins to "trickle down" the risk curve. Traders who have spent the better part of the year holding established assets are now reassessing their portfolios, looking for "catch-up" plays among altcoins that have underperformed during the initial stages of the 2024 rally. This behavior is typical of mid-cycle transitions, where the "wealth effect" from Bitcoin gains begins to fuel speculative interest in the wider ecosystem.
Rebuilding the Altcoin Market Cap
While the volume data provides a real-time look at trader sentiment, the structural health of the altcoin market is best reflected in the "OTHERS" chart, which tracks the total cryptocurrency market capitalization excluding the top 10 largest assets. This metric is currently stabilizing within the $180 billion to $190 billion range, following a period of extreme volatility that saw valuations slashed by more than 50% from their 2025 peaks near $440 billion.
The current stabilization phase is viewed by technical analysts as a "rebuilding" period. Since the local lows established in February, the market has transitioned from a state of capitulation—characterized by high-volume sell-offs and forced liquidations—to a more measured consolidation. A key technical victory for altcoin bulls has been the reclamation of the 200-week moving average (WMA). In long-term technical analysis, the 200-week WMA often serves as the "line in the sand" between a secular bear market and a nascent bull trend. By holding this level as support, the altcoin market is signaling that long-term institutional and retail buyers are beginning to re-engage with the sector.
Technical Indicators and the Compression Zone
Despite the optimistic shift in volume, the broader altcoin market remains in a delicate position. The 50-week and 100-week moving averages are currently flattening and beginning to converge above the current price action. This phenomenon creates what is known as a "compression zone." When multiple long-term moving averages converge, it typically precedes a significant directional breakout. The market is essentially "coiling" like a spring, with the current range-bound trading serving as the build-up of energy.

However, the direction of that breakout remains a subject of intense debate. For a genuine "altseason" to be confirmed, the market cap for the "OTHERS" group must successfully breach the $220 billion to $250 billion resistance zone. Until this level is reclaimed and flipped into support, the market remains in a neutral-to-bearish posture on higher timeframes. Failure to break through this overhead supply could result in a "bull trap," where the recent surge in volume leads to a sharp rejection and a retest of the February lows.
Historical Context: The Long Road from 2022
To understand the significance of the 51% volume share, one must look back at the "altcoin winter" that began in late 2021. Following the collapse of the Terra-Luna ecosystem and the subsequent bankruptcy of FTX in 2022, altcoin valuations were decimated. Many projects saw 90% to 99% drawdowns, leading to a period of deep investor exhaustion. Unlike previous cycles where altcoins recovered in tandem with Bitcoin, the 2023-2024 period was characterized by "Bitcoin Dominance," as institutional inflows were almost exclusively focused on BTC.
For many retail holders, the last three years have been defined by "patience as a strategy." The recent data from Binance is the first concrete evidence that this patience might be rewarded. The rotation of 20 percentage points of volume into altcoins suggests that the market is finally moving past the trauma of the 2022 crash and is willing to once again price in the future potential of decentralized applications, layer-2 solutions, and the burgeoning memecoin economy.
Implications for Market Participants
The shift toward altcoin dominance has several implications for the coming months:

- Increased Volatility: As capital moves into assets with lower liquidity than Bitcoin, the market can expect sharper price swings. While this offers higher profit potential, it also increases the risk of "flash crashes" and cascading liquidations.
- Search for "Beta": Investors are increasingly looking for "high-beta" assets—tokens that move with greater intensity than the market leaders. If Bitcoin moves 5%, traders are looking for altcoins that will move 15% to 20% in the same direction.
- Ethereum’s Identity Crisis: The rapid decline in Ethereum’s volume share highlights a growing narrative shift. With the rise of Solana and various Ethereum Layer-2s, the "mainnet" ETH token is facing stiff competition for its role as the primary venue for decentralized finance (DeFi) and speculative trading.
- The Institutional Lag: While retail traders are leading the charge into altcoins on Binance, institutional capital remains largely tethered to Bitcoin. A sustained altcoin rally likely requires a "bridge" where institutional interest expands into Ethereum ETFs and beyond.
Looking Ahead: The Path to Trend Reversal
The coming weeks will be a critical litmus test for the altcoin market. The data indicates that traders have made their choice, opting to move away from the relative stability of Bitcoin and Ethereum in favor of the broader market. Whether this is a temporary anomaly caused by a quiet Bitcoin market or the beginning of a genuine, multi-month altseason will depend on the market’s ability to clear historical resistance levels.
For now, the 51% volume share stands as a testament to the resilience of the altcoin sector. After years of underperformance, the "speculative engine" of the crypto market appears to be restarting. Investors and analysts alike will be closely watching the $250 billion market cap threshold; a break above that level would likely signal the end of the rebuilding phase and the start of a new, aggressive expansionary chapter in the 2024-2025 cycle. As the volume data suggests, the restlessness of capital is no longer a theory—it is a measurable reality on the world’s largest trading stages.