The cryptocurrency market is witnessing a significant structural shift in capital allocation as altcoins collectively claimed 51% of the total trading volume on Binance, the world’s largest digital asset exchange by liquidity. This milestone marks the first time in the current market cycle that altcoins have commanded a majority share of trading activity, signaling a potential departure from the Bitcoin-centric dominance that has defined much of the past two years. The surge in altcoin engagement comes at the direct expense of the market’s two largest assets, Bitcoin (BTC) and Ethereum (ETH), which have seen their respective volume shares retreat to 30% and 17%. This data, highlighted by market analysts and confirmed by on-chain metrics, suggests that investors are increasingly seeking higher-beta opportunities amidst a period of broader market consolidation.
The transition toward altcoin dominance has been rapid. As recently as early March, the landscape was markedly different, with altcoins accounting for a mere 31% of Binance’s trading volume. At that time, market participants were heavily concentrated in Bitcoin and Ethereum, driven by the launch of spot Bitcoin ETFs in the United States and the subsequent price discovery phase that saw Bitcoin reach new all-time highs. However, as the primary assets entered a range-bound phase characterized by lower volatility and sideways price action, the volume distribution began to shift. Within a six-week window, the altcoin share grew by 20 percentage points, a velocity of rotation that indicates a deliberate repositioning by both retail and institutional traders on the platform.
The Dynamics of Capital Rotation
Capital rotation is a fundamental mechanism in cryptocurrency market cycles. Traditionally, liquidity flows in a "waterfall" fashion: starting with Bitcoin, moving into large-cap assets like Ethereum, and finally trickling down into mid-cap and small-cap altcoins. The current data suggests that the market is deep within the second and third stages of this rotation. According to insights from the analyst known as Darkfost, the consolidation phase currently navigating the broader market is producing a behavioral change visible in trading patterns. Rather than simply holding their positions in "blue-chip" digital assets, investors are actively reassessing their portfolios and moving liquidity into more speculative segments of the market.
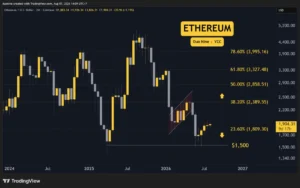
The decline in Ethereum’s volume share is perhaps the most striking component of this shift. On April 11, Ethereum still commanded 27% of the total trading activity on Binance. In less than a fortnight, that figure plummeted to 17%. This 10-percentage-point drop in such a short duration suggests that Ethereum is currently bearing the brunt of the capital exit as traders pivot toward more volatile altcoins. While Ethereum remains the foundational layer for decentralized finance (DeFi) and non-fungible tokens (NFTs), its recent price performance relative to Bitcoin and emerging ecosystems has led some traders to view it as a "laggard," prompting a search for higher returns elsewhere.

Analyzing the "OTHERS" Market Cap
To understand the health of the altcoin market beyond trading volume, analysts point to the "OTHERS" chart, which tracks the total cryptocurrency market capitalization excluding the top 10 assets. This metric provides a clearer picture of the broader altcoin ecosystem’s valuation without the distorting effects of Bitcoin, Ethereum, and major stablecoins. Currently, the altcoin market cap is stabilizing within the $180 billion to $190 billion range. This follows a period of intense volatility where valuations were slashed significantly from their 2025 peaks near $440 billion.
The technical structure of the altcoin market is currently in a "rebuilding" phase. After a sharp drawdown that saw many assets lose 50% or more of their value, the market has managed to reclaim the 200-week moving average (MA). In technical analysis, the 200-week MA is often considered the "line in the sand" for long-term trends; holding above this level suggests that the long-term bullish structure remains intact despite short-term turbulence. However, the market remains beneath the 50-week and 100-week moving averages, which are currently flattening and converging. This convergence creates a "compression zone," a technical phenomenon that often precedes a violent breakout or breakdown.
For a genuine "altseason"—a period where altcoins significantly outperform Bitcoin—to be confirmed, analysts argue that the OTHERS market cap must reclaim and hold the $220 billion to $250 billion resistance zone. Until this level is flipped into support, the current surge in volume may be viewed by skeptics as a "consolidation-phase anomaly" rather than the start of a sustained bull run.
Chronology of the Shift
The path to the current 51% volume share can be traced through several key phases over the last quarter:
- Late February to Early March (The Bitcoin Peak): Bitcoin dominated headlines and volume as it surged toward $73,000. Altcoin volume on Binance languished at 31%, as traders feared missing out on the primary move in BTC.
- Mid-March (The Initial Correction): As Bitcoin and Ethereum hit local peaks and began to correct, liquidity stayed largely within the top two assets as a "flight to safety" mechanism.
- Early April (The Range-Bound Phase): Bitcoin began trading in a defined range between $60,000 and $70,000. Volatility in the leaders dropped, leading to "trader boredom."
- Mid-April (The Rapid Rotation): Ethereum’s dominance began to slip sharply. On April 11, the 27% share started its descent toward 17%, while the altcoin segment began its climb toward the majority 51% share.
- Present (The Altcoin Majority): For the first time this cycle, altcoins represent more than half of the trading activity on the world’s largest exchange, despite the total market cap of altcoins remaining well below previous highs.
Market Sentiment and Expert Perspectives
The shift in volume has sparked a debate among market participants regarding the intent behind the capital movement. There are two primary schools of thought. The first suggests that the rotation reflects genuine conviction. Proponents of this view argue that the "altcoin purge" of 2022 and 2023 has washed out weak hands and overvalued projects, leaving a leaner, more resilient sector ready for growth. They point to the rise of specific sectors—such as Artificial Intelligence (AI) tokens, Real World Assets (RWA), and high-performance Layer 1 blockchains—as evidence of a more sophisticated and narrative-driven market.

The second perspective is more cautious, suggesting the rotation is a symptom of capital restlessness. In this view, traders are simply "chasing green candles" in smaller assets because the larger assets have become stagnant. This type of activity is often characterized by high turnover and low "stickiness," meaning the capital could flow back into Bitcoin just as quickly if the market experiences a renewed sense of macro uncertainty or a fresh Bitcoin breakout.
Darkfost’s analysis leans toward a strategic repositioning. The observation that traders are using range-bound price action to add exposure to "higher-beta assets" suggests a calculated risk-on approach. High-beta assets are those that tend to move more aggressively than the broader market; while they carry higher risk during downturns, they offer the potential for outsized gains during recovery phases.
Implications for the Broader Crypto Ecosystem
The rise of altcoin volume share to 51% has several implications for the coming months. First, it suggests that the "altcoin winter" that has frustrated investors for the better part of three years may be thawing. While valuations have not yet returned to 2021 levels, the activity level indicates that the "sell-side exhaustion" seen in 2022 and 2023 is being replaced by renewed buying interest.
Second, the decline in Bitcoin and Ethereum volume share could lead to a period of "dominance decay." If Bitcoin’s dominance (its percentage of the total crypto market cap) begins to fall alongside its volume share, it would provide the necessary breathing room for altcoins to stage a broader rally. Historically, the most explosive altcoin gains occur when Bitcoin trades sideways or slightly upward while its dominance declines.
Third, the concentration of activity on Binance serves as a barometer for global retail sentiment. Unlike institutional platforms that may focus exclusively on Bitcoin, Binance’s diverse user base often leads the way in identifying emerging trends. The fact that this majority-volume shift is happening on a platform with such deep retail roots suggests that the "average" crypto investor is once again looking beyond the top two assets for profit.

Conclusion: A Rebuilding Phase with Guarded Optimism
The current state of the cryptocurrency market is one of transition. The volume data from Binance provides a clear signal that the monopoly of attention held by Bitcoin and Ethereum is breaking. However, the technical hurdles for altcoins remain significant. The "OTHERS" market cap must overcome structural resistance to turn this volume surge into a sustained trend.
For investors, the data highlights the importance of monitoring liquidity flows rather than just price action. The 20-percentage-point jump in altcoin volume share in just six weeks is a testament to the speed at which the crypto market can evolve. Whether this leads to a legendary "altseason" or remains a temporary spike in speculative activity will depend on the market’s ability to maintain these levels of engagement as the macroeconomic environment continues to shift. For now, the rebuilding of the altcoin market cap continues, supported by a 200-week moving average that has, so far, held firm against the bears.