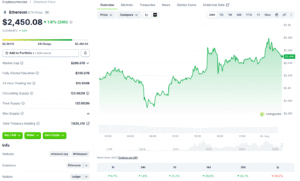
Ethereum, the second-largest cryptocurrency by market capitalization, is currently at the center of intense market speculation, with recent on-chain data suggesting a plausible path toward the $5,000 valuation. As of the time of writing, Ethereum is trading at approximately $2,450.31, marking a 1.49% increase over the past 24 hours and a significant 31.20% rally over the preceding week. This robust performance has ignited discussions among analysts and investors, who are closely monitoring key indicators for signs of continued momentum.
A pivotal development fueling these bullish projections is the emergence of a "golden cross" pattern on Ethereum’s Market-Value-to-Realized-Value (MVRV) Ratio. This technical signal, often interpreted as a strong indicator of an impending uptrend, has led some analysts to identify $5,363 as a potential upside target, contingent upon the successful breach of critical resistance levels. The confluence of several on-chain metrics—including whale accumulation and a notable decline in exchange balances—lends further credence to the optimistic outlook.
Chronology of Recent Bullish Signals
The foundation for Ethereum’s current bullish sentiment was laid on August 19, 2026, when its MVRV Ratio crossed above its 160-day moving average, forming a golden cross. This specific event typically signals that the market value of an asset is beginning to outpace its realized value, often preceding significant price appreciation. According to analyst Ali Charts, Ethereum has witnessed a 34% surge since this signal appeared, climbing from $1,905 to a recent high of $2,547. Data from Glassnode, a leading on-chain analytics firm, has consistently supported the notion that this upward momentum remains firmly intact.
Following this initial MVRV signal, several other on-chain indicators have reinforced the bullish narrative. Whale activity, often a harbinger of significant market movements due to the substantial capital involved, has notably increased. Wallets holding more than 10,000 ETH have seen their holdings grow by 1.74% over the past week, as reported by Santiment Intelligence. This accumulation trend is particularly significant, as the addition of seventeen new whale addresses to the network suggests that large-scale holders are strategically positioning themselves for further gains rather than preparing for sell-offs.
Simultaneously, a consistent decline in Ethereum’s exchange balances has been observed, a trend historically associated with reduced selling pressure. In the past week alone, over 180,764 ETH, equivalent to approximately $440 million, moved off centralized exchanges. This exodus of coins typically indicates a shift towards cold storage solutions or staking protocols, both of which remove readily available supply from the market. A decrease in liquid supply, coupled with sustained demand, naturally creates upward pressure on an asset’s price.
In-Depth Analysis of On-Chain Metrics
To fully appreciate the potential for Ethereum to reach $5,000, it is crucial to delve deeper into the significance of the on-chain metrics at play.

MVRV Ratio and the Golden Cross: The MVRV Ratio is calculated by dividing an asset’s market capitalization by its realized capitalization. Market cap reflects the current price multiplied by the circulating supply, while realized cap aggregates the price of each coin when it last moved on the blockchain. A high MVRV can suggest overvaluation, while a low MVRV might indicate undervaluation. A golden cross on the MVRV Ratio, where a shorter-term moving average crosses above a longer-term one, is often interpreted as a bullish crossover, signaling that the average investor is moving from an unrealized loss or break-even state into profit, encouraging further investment. Historical precedents show that such crossovers have frequently preceded substantial price rallies for Ethereum. This indicator helps identify periods where the market transitions from accumulation phases to expansionary phases.
Whale Accumulation: The behavior of "whales"—entities holding a significant amount of an asset—is a critical gauge of market sentiment and future price direction. When whales accumulate, it suggests a strong conviction in the asset’s long-term prospects. Their movements are often based on extensive research and a deeper understanding of market dynamics, making their accumulation a powerful signal for retail investors. The increase in addresses holding over 10,000 ETH, coupled with the emergence of new whale wallets, underscores a growing confidence among large capital holders in Ethereum’s immediate future. This pattern indicates smart money flowing into the asset, reducing available supply for smaller buyers and potentially accelerating price discovery.
Declining Exchange Balances: The amount of cryptocurrency held on centralized exchanges serves as a proxy for immediate selling pressure. When large quantities of an asset are held on exchanges, it implies that holders are ready to sell at short notice. Conversely, a sustained outflow of coins from exchanges suggests that investors are moving their assets to self-custody wallets or staking platforms. This action is indicative of a long-term holding strategy, often referred to as "HODLing," which reduces the readily available supply for sale and thus diminishes potential downward price pressure. The recent exodus of $440 million worth of ETH from exchanges significantly tightens the liquid supply, making it easier for buying pressure to move the price upwards.
URPD (Unspent Realized Price Distribution): While not explicitly detailed in its calculation, the URPD data mentioned regarding resistance levels is a valuable tool. URPD analyzes the distribution of unspent transaction outputs (UTXOs) by the price at which they were acquired. This helps identify price ranges where a significant volume of an asset was last transacted. These zones often act as strong support or resistance levels because holders who acquired coins at those prices may be inclined to sell as the price approaches their entry point (creating resistance) or buy more if it dips below (creating support).
Understanding Key Resistance Levels
Before Ethereum can embark on a definitive journey toward the $5,000 mark, it must successfully navigate a formidable resistance band situated between $2,722 and $2,970. URPD data indicates that a substantial 16.70 million ETH were acquired within this specific range. This concentration of previously transacted coins creates what analysts term a "significant supply wall" that the price must overcome.
The psychology behind this resistance is straightforward: investors who purchased Ethereum within this range may view current prices as an opportunity to break even or take modest profits, thus increasing selling pressure as the price approaches this zone. This makes the $2,722 to $2,970 corridor a critical test for Ethereum’s broader upward trajectory in the coming weeks. A sustained breakthrough above this level would signal strong underlying demand capable of absorbing this supply, paving the way for further advances. Conversely, a failure to breach this resistance could lead to a temporary pullback.
Should Ethereum fail to surmount this resistance, a retracement towards the Realized Price near $2,235 is considered a plausible outcome. Analysts emphasize that such a scenario would likely constitute a healthy correction within the broader uptrend that commenced in mid-August, rather than a definitive break in the bullish momentum. Market corrections are a natural part of any asset’s price discovery process, allowing for the consolidation of gains and the entry of new buyers.
Broader Market Context and Fundamentals
Ethereum’s current bullish momentum is not occurring in a vacuum. It is influenced by a confluence of broader cryptocurrency market trends and its own robust fundamental developments. The overall crypto market has shown signs of recovery, with Bitcoin often leading the charge, influencing altcoins like Ethereum. Discussions around potential spot Ethereum ETFs, mirroring the excitement surrounding Bitcoin ETFs, could also be contributing to the positive sentiment. Institutional interest in digital assets, driven by increasing regulatory clarity and the recognition of blockchain technology’s potential, continues to grow, potentially channeling more capital into established assets like Ethereum.
Fundamentally, Ethereum remains the bedrock of the decentralized finance (DeFi) and non-fungible token (NFT) ecosystems. Its smart contract platform facilitates a vast array of decentralized applications (dApps), from lending protocols to gaming and digital art marketplaces. Ongoing network upgrades, such as the Merge (transition to Proof-of-Stake) and subsequent improvements like the Dencun upgrade (EIP-4844 for ‘proto-danksharding’), are continuously enhancing the network’s scalability, security, and efficiency. These technological advancements reduce transaction costs and increase throughput, making Ethereum a more attractive platform for developers and users alike, thereby strengthening its intrinsic value proposition. The reduction in ETH issuance post-Merge, coupled with the burning mechanism introduced by EIP-1559, has also made Ethereum a deflationary asset under certain network conditions, further contributing to its scarcity and potential for price appreciation.
Expert Perspectives and Outlook
While the on-chain data presents a compelling case, market analysts maintain a cautious yet optimistic outlook. The target of $5,363, derived from the 2.4 MVRV Pricing Band, represents a significant milestone. This band often indicates an overbought region in previous cycles but can serve as a strong magnet during powerful bull runs. For this target to come into sharp focus, Ethereum requires sustained buying pressure sufficient to absorb the significant supply wall identified between $2,722 and $2,970.
The confluence of whale accumulation and diminishing exchange reserves provides strong foundational support. However, the true test will be the market’s ability to overcome the psychological and technical resistance embedded in the $2,722 to $2,970 range. Analysts suggest that a decisive break above this zone, accompanied by high trading volume, would confirm the strength of the current uptrend and validate the path towards $5,000 and potentially beyond.
Risks and Considerations
Despite the promising indicators, the cryptocurrency market remains inherently volatile and subject to various risks. Regulatory uncertainty across different jurisdictions continues to be a major factor, with potential policy shifts capable of impacting market sentiment. Competition from other Layer 1 blockchains offering alternative solutions for scalability and cost-efficiency also poses a challenge to Ethereum’s dominance. Macroeconomic headwinds, such as unexpected inflation spikes, interest rate hikes, or global economic downturns, could dampen investor appetite for risk assets like cryptocurrencies. Furthermore, technical vulnerabilities or significant network congestion, though mitigated by ongoing upgrades, could still affect user confidence and network utility.
Investors are advised to conduct thorough due diligence and consider the inherent risks associated with cryptocurrency investments. While the on-chain signals are currently robust, market dynamics can shift rapidly, and past performance is not indicative of future results.
In conclusion, Ethereum’s journey towards $5,000 appears increasingly plausible, underpinned by a potent combination of bullish on-chain metrics, including a golden cross on its MVRV Ratio, significant whale accumulation, and a notable reduction in exchange supply. The immediate challenge lies in breaching the critical resistance zone between $2,722 and $2,970. Success in overcoming this hurdle could set the stage for Ethereum to retest and potentially surpass its previous all-time highs, solidifying its position as a leading digital asset in the evolving landscape of decentralized finance and Web3.