This Friday’s market analysis delves into the recent price movements and technical outlooks for several prominent cryptocurrencies: Ethereum (ETH), Ripple (XRP), Cardano (ADA), Binance Coin (BNB), and Hyperliquid (HYPE). While some digital assets are navigating periods of consolidation, others are facing significant resistance levels, indicating potential shifts in market sentiment and investor strategies.
Ethereum (ETH): Testing Support Amidst Resistance Rejection
Ethereum, the second-largest cryptocurrency by market capitalization, encountered a significant setback this week as it was decisively rejected at the $2,400 resistance level. This crucial price ceiling, which has been a focal point for traders, proved insurmountable for bullish forces. The failure to breach this level has led to a downward price trajectory, with the cryptocurrency now appearing to curve towards the established support zone around $2,000.
Despite the price remaining in a similar vicinity to the previous week, the observable weakness in recent trading days signals a potential resurgence of selling pressure. This suggests that the prevailing bullish momentum may be waning, and a bearish sentiment could be reasserting itself. Such a development is unwelcome for investors who had anticipated a sustained upward trend and the establishment of higher highs.
Looking ahead, Ethereum’s immediate future hinges on its ability to successfully navigate its current pullback. Before any renewed assault on the $2,400 resistance can be contemplated, ETH will likely need to complete this corrective phase. A price point around $2,000 in the coming week appears to be a probable scenario. If this support level holds firm, providing a stable foundation, bulls may then be presented with another opportunity to challenge the key resistance.

The technical chart for Ethereum reveals a pattern of resistance at $2,400, a level that has historically acted as a significant barrier. The inability of buyers to overcome this price point suggests a strong presence of sellers in that range. Conversely, the $2,000 mark has previously served as a support, and its resilience will be critical in determining the short-term direction of ETH. The volume indicators will also be closely watched for signs of increasing buy or sell pressure. A sustained increase in selling volume as the price approaches $2,000 could indicate further downside potential, while a surge in buying volume at this level might signal a reversal.
The broader context for Ethereum includes ongoing developments within its ecosystem, such as upgrades to the network and increasing adoption of decentralized applications (dApps). However, macroeconomic factors and broader market sentiment often play a more immediate role in short-term price action. The current rejection at resistance suggests that these external influences, combined with internal selling pressure, are outweighing the positive fundamental developments for the moment.
Ripple (XRP): Caught in a Pennant Formation, Facing Support Challenges
Ripple’s XRP has also experienced a week of sideways trading, largely failing to break out of its current pennant formation. Buyers have struggled to maintain a foothold above the $1.40 support level, which is now reportedly being challenged by sellers. This development introduces a degree of uncertainty regarding XRP’s near-term prospects.
Should XRP fail to sustain its position above the $1.40 mark, the technical bias is likely to shift towards bearish. This could increase the probability of a price breakdown below the pennant, potentially paving the way for XRP to revisit the significant support level at $1.00 in the future.
From a longer-term perspective, XRP remains entrenched in a macro downtrend, despite a period of consolidation and sideways movement that began in February, giving rise to the current pennant formation. Ideally, the market seeks a clear and decisive breakout from such chart patterns. However, the current struggle to maintain support suggests that achieving this bullish resolution may be an ambitious undertaking in the immediate future.
The pennant pattern, characterized by converging trendlines, typically indicates a period of consolidation before a continuation of the prior trend. In XRP’s case, the preceding trend was downward. A successful breakout above the upper trendline of the pennant would typically signal a bullish continuation, while a breakdown below the lower trendline would confirm a bearish continuation. The current test of the $1.40 support is occurring near the apex of this pattern, making the outcome particularly critical.
Analysts are closely monitoring the trading volume associated with XRP’s price movements. A significant increase in volume accompanying a breakdown below $1.40 would lend further credence to the bearish outlook. Conversely, a strong surge in buying volume and a decisive reclaim of the $1.40 level could invalidate the bearish thesis and set the stage for a potential upward move.
The regulatory landscape surrounding Ripple continues to be a significant factor influencing XRP’s price. Any positive or negative developments in the ongoing legal proceedings could have a profound impact on investor sentiment and, consequently, on XRP’s market performance. While technical analysis provides a framework for understanding price action, fundamental factors remain paramount for long-term valuation.
Cardano (ADA): A Glimmer of Optimism Amidst Resistance
In a surprising turn of events, Cardano (ADA) has demonstrated a more positive performance this week, registering a notable 5% gain. This upward momentum allowed ADA to test a key resistance level at $0.28. However, sellers intervened effectively, preventing a decisive breach and pushing the price back down. At present, the cryptocurrency is undergoing a pullback.
Despite this temporary setback, the fact that Cardano achieved a higher high during its ascent offers a degree of optimism. This suggests that another attempt at breaching the $0.28 resistance could prove successful. If bullish forces can maintain the price above the $0.25 support level, this outcome appears increasingly likely.
Looking ahead, this marks the first instance in over a month where ADA has exhibited tangible breakout potential. Encouragingly, buy volume has also seen an uptick, lending further confirmation that buyers are returning to the cryptocurrency. This renewed interest could provide the necessary fuel for ADA to overcome its immediate resistance.
The technical chart for Cardano shows a clear pattern of resistance around $0.28, a level that has acted as a ceiling for previous upward attempts. The $0.25 level, on the other hand, has provided support. The recent higher high indicates a constructive move, suggesting that the underlying demand for ADA may be strengthening. The increase in trading volume during the upward move further supports this bullish interpretation.
The Cardano ecosystem has been actively developing, with ongoing updates to its network and a growing number of dApps being built on its platform. These fundamental developments, coupled with the recent positive price action, could contribute to sustained investor interest. The ability of ADA to break through the $0.28 resistance could signal the beginning of a more significant upward trend, attracting further capital into the ecosystem.
Binance Coin (BNB): Consolidating Within a Range, Awaiting Momentum
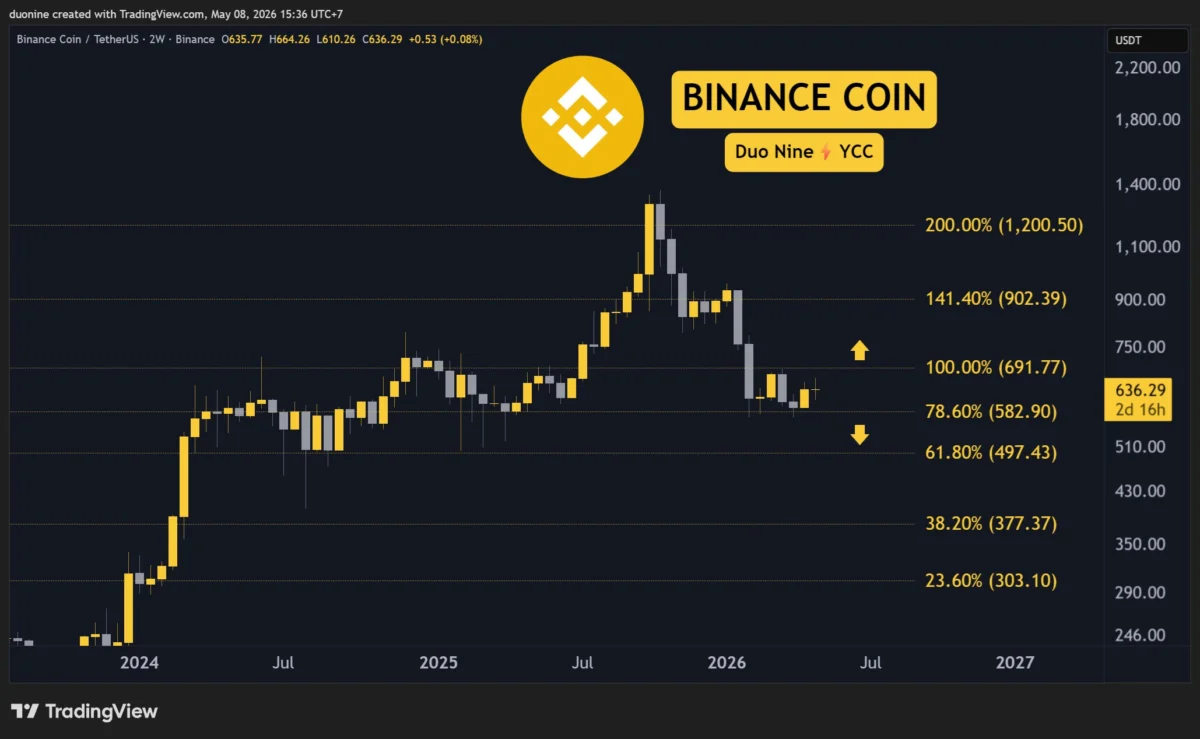
Binance Coin (BNB) concluded the week with a modest 3% gain, managing to establish a higher high around the $660 mark. However, this ascent was insufficient to challenge the key resistance level situated at $690. For BNB to successfully break through this significant barrier, buyers will need to exert greater effort and sustain the current buy volume.
The resistance at $580 has been tested on multiple occasions and has held firm, providing a stable floor that has prompted the price to trend higher. Nevertheless, for a decisive breakout to occur, the current momentum needs to accelerate.
Looking ahead, Binance Coin appears to be consolidating within a defined horizontal range, oscillating between $580 and $690. This pattern has been in effect since late February. The hope among investors is that bullish forces can gain sufficient control to exert sustained pressure on the $690 resistance in the coming days and weeks.
The technical outlook for BNB suggests a period of equilibrium between buyers and sellers within the identified range. The $580 support has proven robust, preventing further declines, while the $690 resistance has acted as a formidable obstacle to upward progress. The volume analysis will be crucial in determining the direction of the next significant move. A substantial increase in buying volume as BNB approaches $690 could signal an impending breakout, while a surge in selling volume at this level might indicate a reversal.
The performance of Binance Coin is intrinsically linked to the broader performance of the Binance exchange and the overall cryptocurrency market. As the native token of the world’s largest cryptocurrency exchange by trading volume, BNB benefits from increased activity and adoption on the platform. Continued growth in trading volume, new product offerings, and increased utility for BNB within the Binance ecosystem could all contribute to a stronger upward trajectory.
Hyperliquid (HYPE): At a Critical Juncture, Facing Resistance Pressure
Hyperliquid (HYPE) concluded the week in positive territory with a 6% gain. While this performance is encouraging, it appears to be insufficient to meaningfully challenge the significant resistance at $43. This level continues to cap bullish advances and confine buyers. For HYPE to ascend to new highs, this resistance must be decisively broken and subsequently converted into a support level.
Considering that this cryptocurrency has struggled to breach the $43 key resistance for over three weeks, this prolonged consolidation could be interpreted as a sign of underlying weakness. In previous instances, bullish momentum for HYPE was considerably more aggressive. The current lack of conviction among buyers might present an opportunity for sellers to capitalize on the situation.
Looking ahead, HYPE finds itself at a critical juncture. The cryptocurrency faces a pivotal decision point: either it successfully breaks above the $43 resistance in the near future, or the price may enter a corrective phase, potentially revisiting support levels at $36 and $30.
The technical chart for HYPE clearly illustrates the formidable resistance at $43, a level that has repeatedly halted upward price action. The subsequent support levels at $36 and $30 represent potential areas where buying interest might emerge if the price experiences a significant downturn. The recent 6% gain, while positive, has not been accompanied by the kind of volume that typically precedes a strong breakout. This suggests that the bullish conviction may be tentative.
The implications of a failure to break the $43 resistance could lead to a broader market correction for HYPE, potentially triggering stop-loss orders and accelerating selling pressure. Conversely, a decisive breakout above $43, supported by strong volume, could ignite a new bullish phase, attracting both retail and institutional investors. The cryptocurrency’s performance will be closely watched in the coming trading sessions as it navigates this crucial technical level.
Broader Market Implications and Investor Outlook
The mixed performance across these prominent cryptocurrencies highlights the current state of the cryptocurrency market, characterized by a balance between cautious optimism and prevailing headwinds. While Cardano shows promising signs of a potential breakout, Ethereum and Ripple face significant resistance and support challenges, respectively. Binance Coin continues its consolidation, awaiting a catalyst for a decisive move, while Hyperliquid stands at a critical technical juncture.
Investors are closely monitoring these key levels and indicators for signs of a sustained trend. The broader macroeconomic environment, regulatory developments, and ongoing technological advancements within the blockchain space will continue to influence price action. As the market navigates these complex dynamics, a thorough understanding of technical analysis, coupled with an awareness of fundamental factors, remains essential for informed investment decisions. The coming weeks will likely provide further clarity on the short-to-medium term trajectory of these significant digital assets.