The cryptocurrency market, characterized by its inherent volatility, is currently witnessing a sustained correction in the price of PI Network’s native token, PI. This downward trend, which has persisted for several consecutive weeks, raises critical questions about the token’s immediate future trajectory. Investors and market observers are closely monitoring key support and resistance levels to gauge potential turning points.
PI Network Faces Prolonged Price Correction
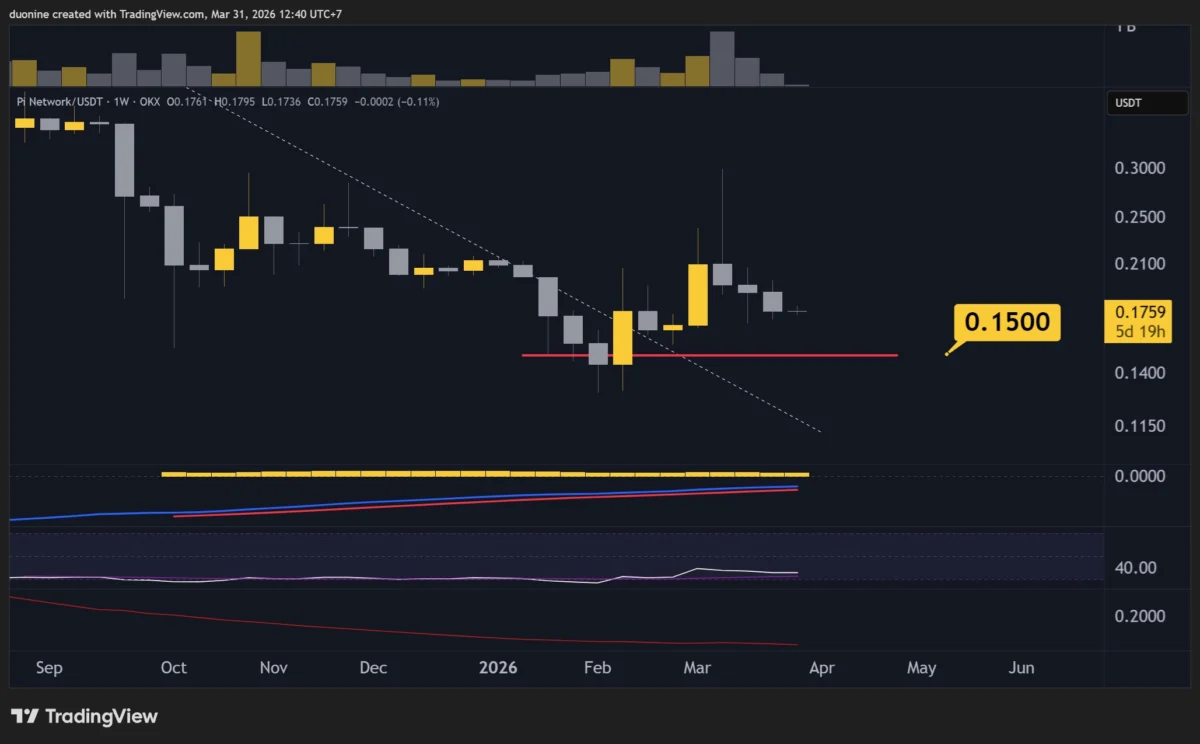
PI has experienced a significant downturn, shedding approximately 40% of its value from a high of $0.30 to a recent low of $0.17. While such a substantial correction might typically signal a potential buying opportunity for those with a bullish outlook, the subsequent price action has introduced a layer of concern. In the past week, PI has been trading within a narrow, sideways range around the $0.18 mark. This period of consolidation, while seemingly benign, can often be a precursor to further downside if buying pressure fails to materialize.
The extended sideways movement around these levels presents a risk of increased seller activity. As prices stagnate, dormant sellers may re-enter the market, attempting to push the token to new lows. For a bullish reversal to gain traction, buyers need to step in decisively and propel PI’s price back above the $0.20 resistance level. Failure to do so leaves the door open for bears to exert further downward pressure.
Declining Trading Volume Hints at Market Indecision
On a more positive note, a notable decrease in trading volume has accompanied the recent price action. This reduction in activity can be interpreted in several ways. It might indicate a waning interest from sellers, suggesting that they are either hesitant to offload their holdings at current levels or are waiting for clearer market signals. This diminished selling pressure has allowed PI to maintain its sideways consolidation.
However, this low volume environment also means that the market is not yet exhibiting strong buying conviction. The absence of robust demand leaves PI vulnerable to potential downward movements. If this trend of low volume and sideways trading persists without a significant influx of buyers, the overall market sentiment for PI could lean bearish, granting sellers a more advantageous position.
Key Price Levels to Watch
Technical analysis of PI’s price chart highlights several critical levels that will likely dictate its short-to-medium term performance.
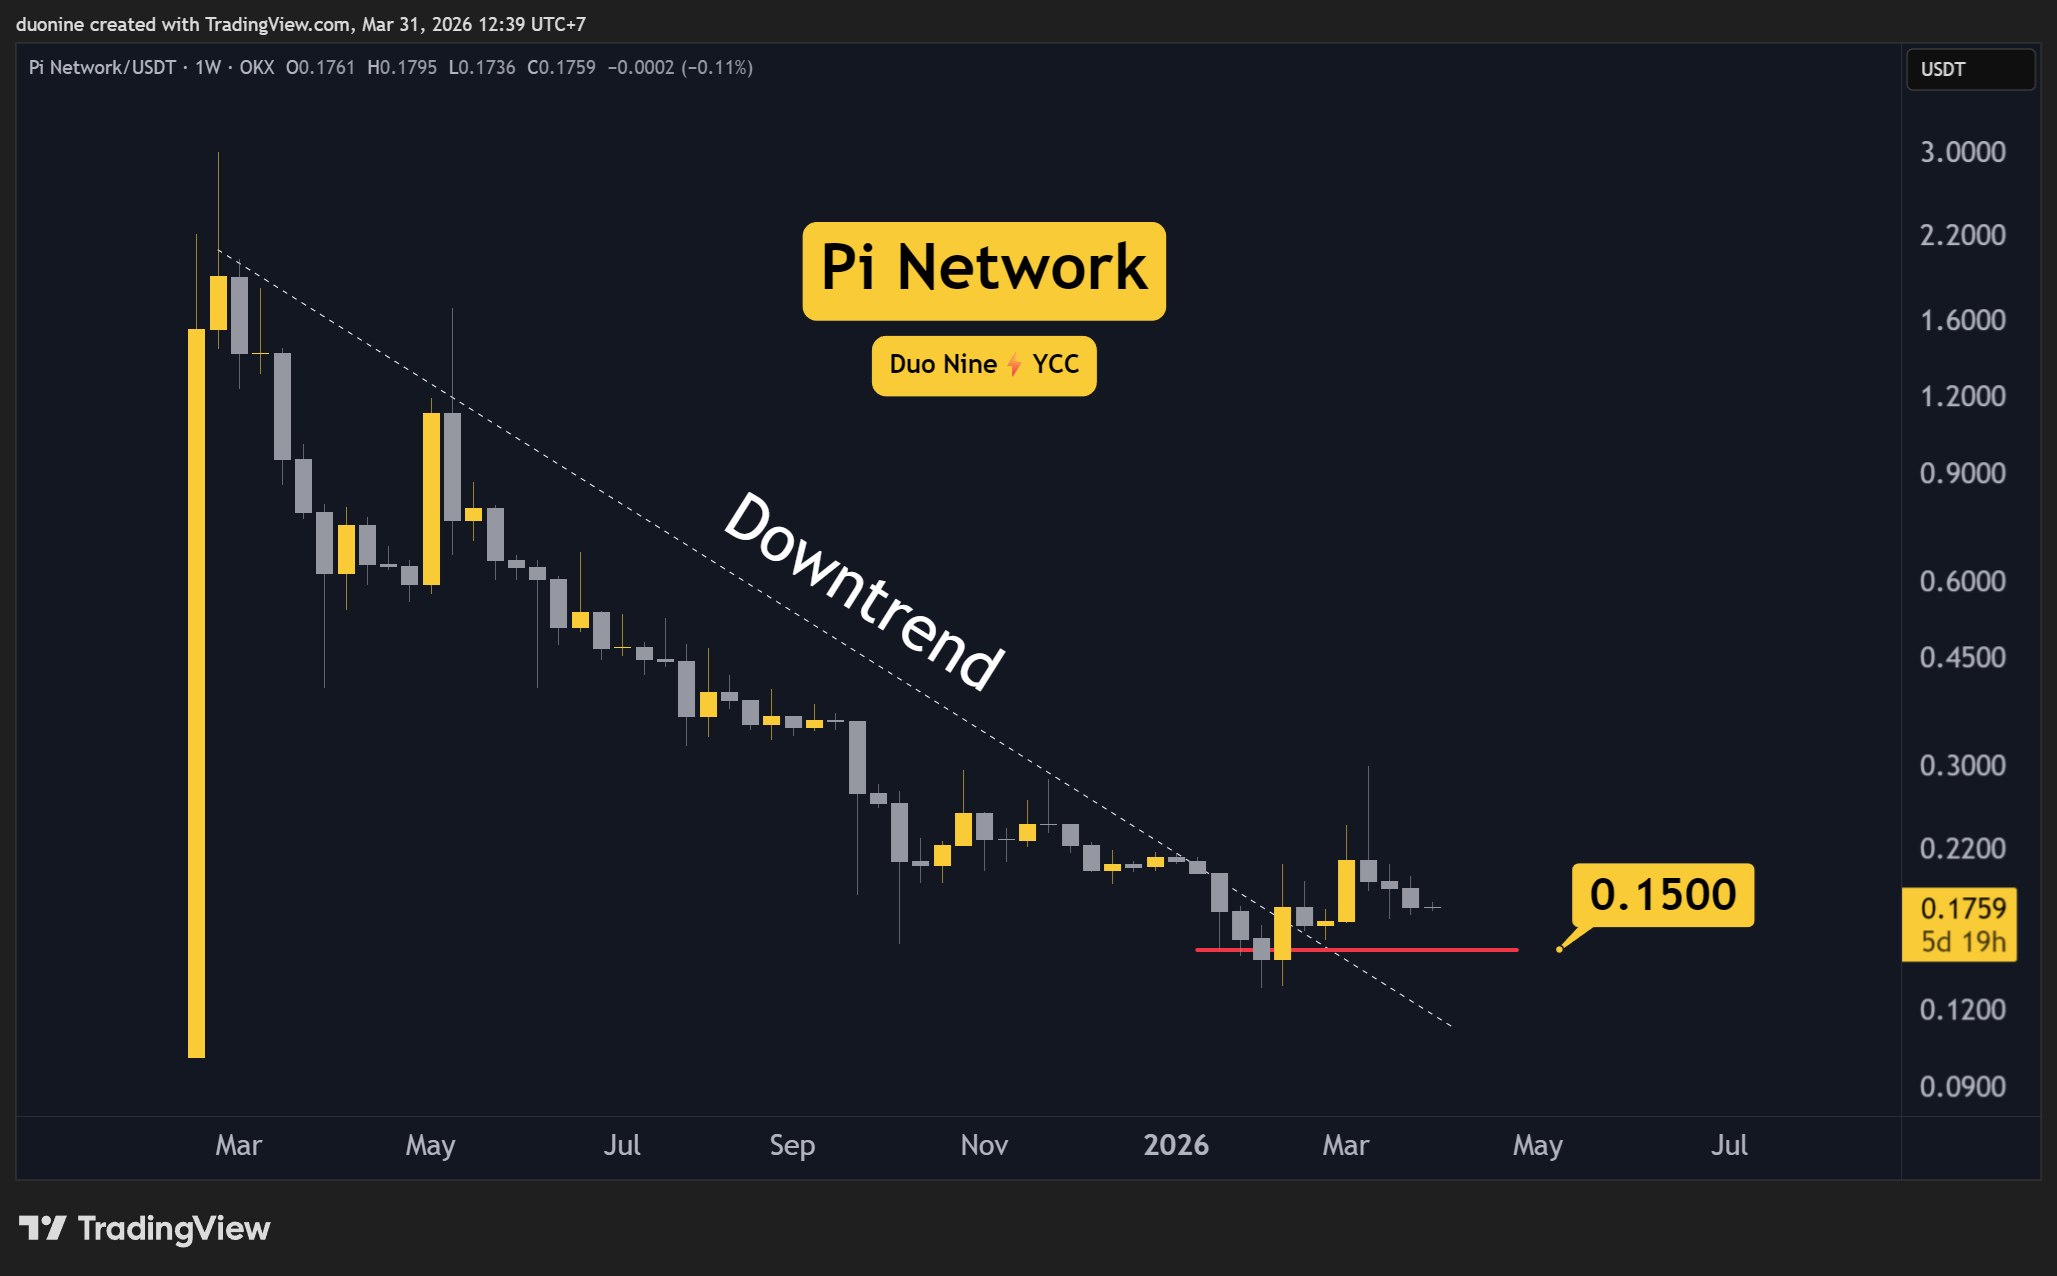
- Key Support Level: $0.15. This level represents a significant psychological and technical floor. A breach below this point could confirm the continuation of the downtrend and potentially trigger further selling pressure, aligning with the breakout level of a major downtrend that began in 2025.
- Key Resistance Levels: $0.20 and $0.28. The $0.20 mark is the immediate hurdle that PI needs to overcome to signal a potential shift in momentum. A sustained move above this level would be a positive development for buyers. The $0.28 level represents a more substantial resistance, and breaking through it would indicate a stronger bullish recovery.
The RSI Indicator Signals Continued Bearish Momentum
Further analysis of PI’s daily chart reveals a bearish signal from the Relative Strength Index (RSI). The RSI, a momentum oscillator used to measure the speed and change of price movements, has been persistently trading below the 50-point mark. This indicates that selling pressure has been dominant over buying pressure in recent trading sessions.
As long as the RSI remains below 50, the prospects for a significant price reversal appear limited. While the moving average of the RSI has shown a slight upward curve recently, this alone is not a definitive indicator of a trend reversal. A confirmed bullish signal from the RSI would require a decisive break above the 52-point level, which corresponds to the last significant high recorded on the chart. Such a move would suggest that buying momentum is building and could pave the way for a recovery.
Historical Context and Market Dynamics
The PI Network project aims to create a cryptocurrency that can be mined on mobile devices without significant energy consumption, positioning itself as an accessible entry point into the digital asset space. Launched with the promise of a user-friendly mining experience, PI has garnered a substantial user base, though its token has yet to be listed on major cryptocurrency exchanges, limiting its direct tradability and price discovery mechanisms in the open market. This lack of official exchange listings often leads to price speculation based on over-the-counter (OTC) trades and community valuations, which can be less transparent and more volatile.
The current correction can be viewed within the broader context of the cryptocurrency market’s cyclical nature. Following periods of significant growth, corrections are a natural part of market cycles, allowing for price discovery and the weeding out of weaker hands. However, the prolonged nature of PI’s downturn, coupled with the dwindling trading volume and bearish RSI signals, suggests that the market is grappling with uncertainty regarding its future valuation and utility.
Potential Scenarios and Investor Outlook
Given the current technical indicators, two primary scenarios emerge for PI in the coming days and weeks:
-
Continued Bearish Trend: If PI fails to break above the $0.20 resistance level and selling pressure intensifies, a drop towards the $0.15 support level becomes increasingly likely. This scenario would confirm the continuation of the established downtrend and could lead to further price erosion. The $0.15 level is particularly significant as it coincides with a prior breakout point from a major downtrend, making it a crucial area of psychological and technical importance.
-
Potential for a Rebound: A decisive surge in buying volume and a sustained move above the $0.20 resistance could signal a potential reversal. This would require a shift in market sentiment, possibly driven by positive project developments, increased adoption, or a broader upturn in the cryptocurrency market. In such a scenario, the $0.28 resistance level would become the next target.
The vanishing trading volume, while currently contributing to the sideways movement, also presents an opportunity. If this low volume period is followed by a strong influx of buyers, it could lead to a swift upward price movement, especially if there is pent-up demand. However, the current indicators do not strongly support this immediate outcome.
Broader Implications for PI Network
The ongoing price correction and market uncertainty have broader implications for the PI Network ecosystem. For users and potential investors, it underscores the speculative nature of cryptocurrency investments and the importance of thorough due diligence. The project’s success hinges not only on its technological innovation but also on its ability to navigate market dynamics and achieve wider adoption and exchange listings.
The lack of official exchange listings for PI has been a long-standing point of discussion within the community. While the project has focused on building its user base and ecosystem, the absence of a regulated and accessible trading platform can hinder organic price discovery and liquidity. Future developments regarding exchange listings could significantly impact PI’s price trajectory and market perception.
Conclusion: Awaiting a Clearer Signal
The PI Network token is currently navigating a challenging period of price correction. The confluence of a 40% drawdown, prolonged sideways trading, declining volume, and a bearish RSI indicator paints a picture of market indecision with a lean towards bearish sentiment. Key price levels at $0.15 for support and $0.20/$0.28 for resistance will be crucial in determining the immediate future direction. Investors are advised to closely monitor these levels and look for decisive price action and increased trading volume before making any investment decisions. Until a clear bullish signal emerges, caution remains the prevailing sentiment in the PI market.