The cryptocurrency market, known for its inherent volatility and rapid price swings, is currently observing a period of consolidation for the PI Network’s native token, PI. For the past several weeks, PI has been trading within a defined horizontal channel, a pattern that technical analysts interpret as a phase of indecision before a potential directional breakout. The critical question on the minds of investors and observers is whether PI can successfully breach these established price barriers and embark on a new upward trajectory, or if it will remain trapped in its current trading range.
PI Stuck in a Price Channel: The Current Market Landscape
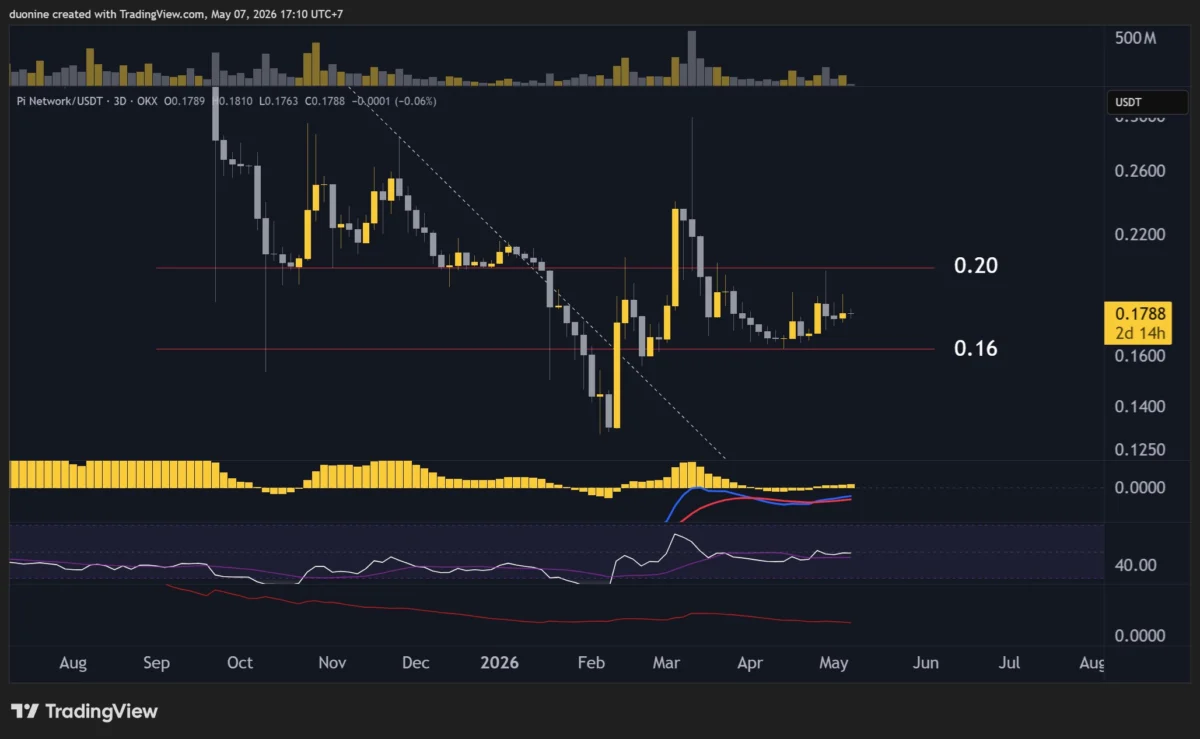
Since hitting a low point of approximately $0.13, the PI cryptocurrency has found itself trading within a narrow band, fluctuating between $0.16 and $0.20. This trading range has been remarkably persistent since early March, with numerous attempts by both buyers and sellers to break free being met with significant pushback. This persistent range-bound behavior suggests a delicate balance of supply and demand, where neither bulls nor bears have managed to exert decisive control.
A notable instance of this struggle occurred in late April. During this period, there was a discernible effort by buyers to push the price above the $0.20 resistance level. However, this upward momentum was short-lived. The buying pressure was quickly absorbed by a surge in selling volume, which occurred on two distinct occasions. This increased selling pressure effectively nullified the bullish attempts and forced the PI price back towards its established support at $0.16. Such patterns of failed breakouts often indicate the strength of the resistance level and the determination of sellers to defend it.

The visual representation of this price action, as depicted in charting analysis, clearly illustrates the formation of a horizontal channel. This pattern is characterized by parallel support and resistance lines, with the price oscillating between them. The duration of this consolidation phase is a key factor for traders, as prolonged periods within a channel can often precede a more significant price movement once the breakout occurs.
Momentum Indicators Signal Indecision
The current market sentiment surrounding PI, as reflected by its momentum indicators, is one of flatness and a lack of clear directional conviction. Since March, when the price entered this channel, most momentum oscillators have been oscillating around their mid-range levels, refusing to decisively tip in favor of either the bulls or the bears. This indicates that the underlying buying and selling pressures are nearly equal, leading to the sideways price action.
While there were observed increases in trading volume during late April and into May, these surges were not substantial enough to overcome the resistance at the $0.20 mark. This suggests that while there was increased interest, it was not sufficient to trigger a sustained breakout. However, the fact that these volume spikes occurred during attempts to breach resistance could be interpreted as a sign that underlying demand exists, and a future attempt might be more successful.
If PI does manage to break convincingly above the $0.20 resistance, the next significant target for bullish traders would be the $0.28 level. This higher resistance point represents a more substantial psychological and technical barrier, and a successful breach here would signal a significant shift in market sentiment. Conversely, a failure to break $0.20 and a subsequent fall below the $0.16 support could lead to a further decline, with traders looking for the next significant support level, potentially revisiting the earlier lows around $0.13.
The Daily RSI: A Barometer of Buyer Strength
The Relative Strength Index (RSI) on the daily chart for PI Network has also been exhibiting a neutral stance, hovering around the midpoint of 50 for the past week. The RSI is a momentum oscillator that measures the speed and change of price movements. A reading above 70 typically indicates overbought conditions, while a reading below 30 suggests oversold conditions. A reading around 50 signifies a balance between buying and selling pressure, or a lack of strong momentum in either direction.
The RSI’s current position around 50 reinforces the observation that PI’s price has been moving sideways, oscillating around the approximate $0.18 mark, which lies in the middle of its current trading channel. For a bullish breakout to gain sustainable traction, the daily RSI would ideally need to move decisively above 50 and begin trending towards the 70 level. Such a movement would signal a strengthening of buying momentum and a renewed confidence among investors.
A sustained push above 50 on the RSI, coupled with a successful retest and hold of the $0.20 resistance, would likely build significant confidence for further upward movement. This could also coincide with a renewed assault on the $0.20 resistance, potentially leading to the desired breakout. The interplay between price action and momentum indicators is crucial for traders seeking to identify potential turning points and the strength of prevailing trends.
Broader Context and Potential Implications
The PI Network, launched in 2020, operates on a unique model of mobile cryptocurrency mining, allowing users to mine PI coins using their smartphones without significant battery drain. The project aims to create a cryptocurrency ecosystem that is accessible to a broad audience. However, it’s important to note that PI has not yet been listed on major cryptocurrency exchanges, and its official trading value remains subject to internal market dynamics and potential future listings. The current price points discussed are indicative of the internal valuation within the PI community and its nascent market.
The consolidation phase for PI can be viewed through several lenses. From a technical perspective, it represents a period of price discovery and consolidation of previous gains or losses. For the project itself, this period of stability, if followed by a breakout, could generate positive sentiment and attract further developer interest and user adoption.
The key resistance levels at $0.20 and $0.28, and the support at $0.16, are crucial reference points. A breakout above $0.20, especially with increasing volume and positive momentum indicators, could signal the beginning of a significant upward trend. This would likely involve a re-evaluation of PI’s market potential and could attract attention from a wider audience of crypto investors.
Conversely, a failure to break $0.20 and a subsequent dip below $0.16 could lead to a period of pessimism. The market would then look for the next level of support, potentially at $0.13 or lower, to establish a new floor for the price. The behavior of volume during any attempted breakouts will be a critical determinant of their success. Higher volume accompanying a price surge above resistance suggests strong buying conviction, while low volume breakouts are often seen as less sustainable.
The current market conditions for PI are characterized by a delicate equilibrium. The community’s efforts to build an ecosystem and the anticipation of potential future developments are being weighed against the broader cryptocurrency market’s sentiment and the technical challenges presented by resistance levels. The coming weeks will be crucial in determining whether PI can break free from its current trading channel and establish a new price discovery phase. Investors and enthusiasts will be closely watching for any signs of increased buying pressure, decisive momentum shifts, and ultimately, a successful breach of the key resistance levels that have so far contained its price action. The trajectory of PI will be a compelling case study in how nascent cryptocurrency projects navigate periods of consolidation and the challenges of achieving sustained price growth.