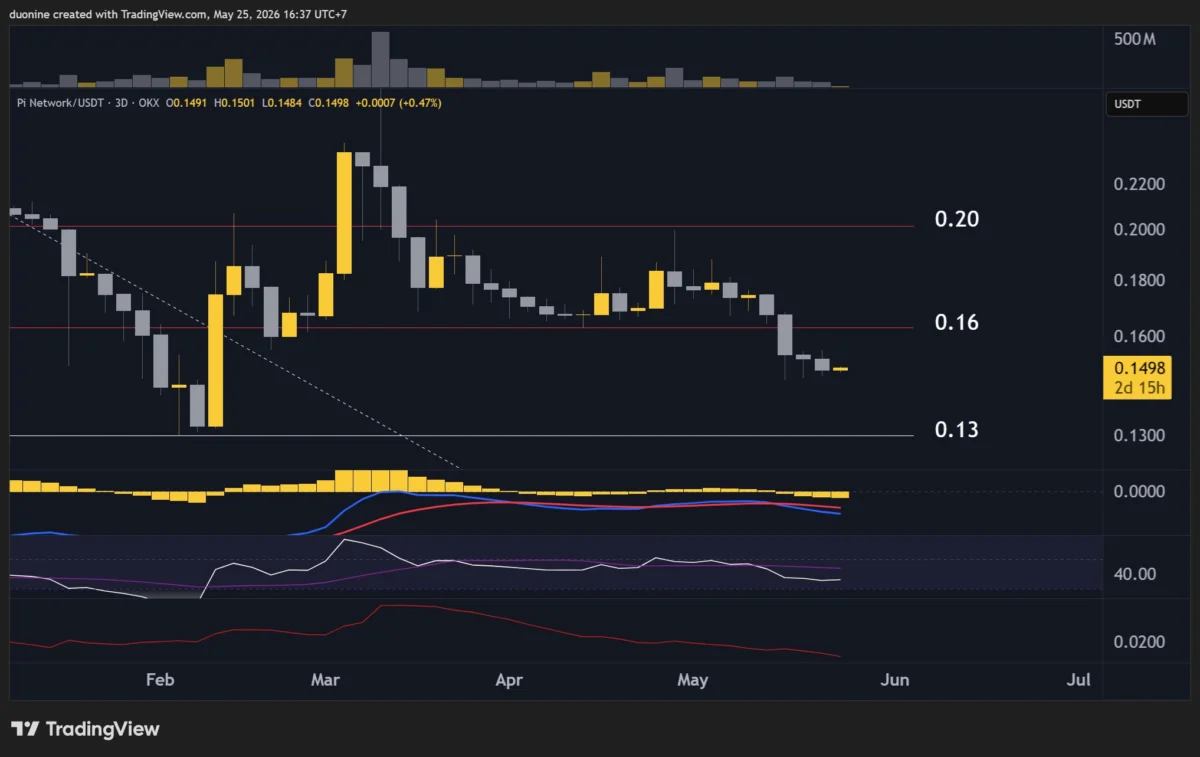
The cryptocurrency market is a dynamic landscape, constantly presenting new challenges and opportunities for investors. Within this volatile environment, the PI Network (PI) has recently found itself at a critical juncture, with its price hovering around the $0.15 mark. This level has historically served as a support, but the question on many investors’ minds is whether this current support can withstand the prevailing downward pressure. The PI Network’s journey in the market has been one of significant volatility, and its current price action warrants a closer examination of the technical indicators and market sentiment surrounding it.
PI Network’s Downtrend and Key Support Levels
The PI Network’s price has been experiencing a sustained downtrend, a common phenomenon in the cryptocurrency market that can be influenced by a multitude of factors, including broader market sentiment, regulatory developments, and project-specific news. Following a breakdown below the $0.16 support level, the price of PI quickly descended to $0.15. At this level, there has been observable interest from buyers, suggesting a potential floor. However, analysts caution that it is premature to definitively state whether this support will hold.
A more robust historical support level for PI is identified at $0.13. This price point has previously demonstrated its ability to reject bearish attempts, acting as a significant psychological and technical barrier for sellers. The retest of these lower levels underscores the bearish sentiment that has permeated the PI market in recent times.
The current breakdown below $0.16 has effectively handed the initiative back to the sellers. This indicates that despite the attempts by buyers to arrest the decline, the momentum of the downtrend remains a dominant force. This situation is particularly disheartening for PI holders, considering the token has already experienced a substantial correction, plummeting by approximately 96% from its all-time high. This significant retracement suggests that the asset has been under considerable selling pressure for an extended period.
Analyzing Seller Behavior and Potential Reversal Signals
Despite the prevailing bearish trend, a closer look at the trading activity reveals some nuances that could hint at a potential shift in market dynamics. While sellers currently hold the upper hand, their trading volume has remained relatively low. Furthermore, the price action has been characterized by lower highs, a pattern that typically signifies a lack of strong conviction among sellers. This suggests that while they are pushing the price down, they may be unwilling or unable to commit to significantly larger sell orders that would drive PI much further into negative territory.
The low sell volume, coupled with the current price action near the $0.15 support, creates a scenario where buyers could potentially stage a comeback. If the $0.15 support level holds firm, it could provide a foundation for buyers to attempt a recovery. The next immediate target for such a recovery would be to reclaim the $0.16 level. A successful breach of this resistance could signal a rebuilding of bullish momentum and potentially initiate a reversal, allowing PI to recoup some of its recent losses.

The MACD Indicator and Bullish Divergence
Technical analysis often relies on indicators to gauge market sentiment and predict future price movements. The Moving Average Convergence Divergence (MACD) is one such widely used tool. In the case of PI Network, the 3-day MACD has been trending downwards, with its histogram consistently reaching new lows. This bearish signal, in isolation, points towards continued downward pressure.
However, the context in which this bearish trend is occurring is crucial. The decline in the MACD is happening concurrently with decreasing sell volume. This divergence between the MACD’s bearish trajectory and the diminishing selling pressure can be interpreted as a potential bullish divergence. A bullish divergence often suggests that the underlying momentum of the asset is shifting, and a price reversal may be on the horizon.
The MACD histogram’s performance this week will be a critical factor to monitor. If the histogram begins to flatten or even turn upwards, it would be the first clear technical signal that sellers are losing their grip on the price. Such a development could pave the way for a relief rally, offering a much-needed respite for PI investors.
Broader Market Context and PI Network’s Position
The cryptocurrency market operates as an interconnected ecosystem. The performance of major cryptocurrencies like Bitcoin and Ethereum often sets the tone for altcoins, including PI. A general market downturn can drag even fundamentally strong projects lower, while a broader market rally can provide a tailwind for recovery.
The PI Network operates within a unique niche, focusing on mobile-first cryptocurrency mining. Launched in 2019, its primary goal has been to make cryptocurrency accessible to a wider audience through a simple mobile application. The project has garnered a substantial user base, with millions of users reportedly mining PI tokens. However, the token’s official listing on major exchanges and its subsequent price performance have been a source of frustration for many in its community. The token’s journey from its initial concept to its current market standing has been marked by anticipation and, for many, a sense of unfulfilled potential regarding its market valuation.
The current price action at $0.15 can be seen as a critical battleground. If buyers can successfully defend this level and initiate a recovery, it could reignite confidence in the project and attract more trading volume. Conversely, a sustained break below $0.15 could lead to further declines, potentially targeting the $0.13 support level.
Implications for Investors and the Path Forward
For investors holding PI, the current situation presents a dilemma. The significant retracement from its all-time high suggests that many early investors may be at a loss. However, the recent price action, particularly the low sell volume and the potential for a bullish divergence on the MACD, could offer a glimmer of hope for a short-term recovery.
Key resistance levels to watch in the event of a bullish turn include $0.16, which has recently acted as support and could now serve as resistance, and $0.20, a more significant psychological and technical barrier. A sustained move above these levels would be necessary to confirm a trend reversal.
The PI Network’s development roadmap and any upcoming announcements regarding its ecosystem or potential exchange listings will also play a crucial role in shaping its future price trajectory. The project’s ability to deliver on its promises and foster real-world utility for its token will be paramount in attracting sustained investor interest and driving long-term value.
Historical Price Performance and Market Sentiment
To understand the current situation, it’s important to consider PI’s historical price movements. While the provided text mentions a 96% correction from its all-time high, the exact figures and dates of these highs and subsequent lows are crucial for a comprehensive analysis. Without specific historical data points, it is challenging to pinpoint the exact period of its peak valuation and the timeline of its decline. However, the narrative of a substantial price drop is clear and sets the stage for the current market dynamics.
The cryptocurrency market is heavily influenced by sentiment. News, social media trends, and the general economic climate can all impact investor behavior. For PI Network, a project with a large, engaged user base, positive sentiment can be a powerful driver. Conversely, negative sentiment, often fueled by perceived stagnation or unmet expectations, can exacerbate selling pressure.
The current low trading volume during this downward move is a double-edged sword. On one hand, it suggests a lack of strong selling conviction, which could be a precursor to a bounce. On the other hand, it also indicates a lack of strong buying interest, meaning that any potential recovery might be fragile and susceptible to renewed selling pressure.
Conclusion: A Precarious Balance
The PI Network is currently navigating a critical period. The $0.15 support level is under intense scrutiny, and its ability to hold will be a significant determinant of the near-term price direction. While the overall trend remains bearish, the declining sell volume and the potential for bullish divergence on the MACD offer a ray of hope for investors.
The coming days and weeks will be crucial in determining whether PI can break its downtrend and embark on a path to recovery, or if it will succumb to further selling pressure, testing lower support levels. Investors and observers will be closely watching for signs of increasing buying conviction and a potential shift in market sentiment. The PI Network’s journey continues to be one of significant interest, with its price action reflecting the broader complexities and volatilities inherent in the cryptocurrency market.
Disclaimer: This article provides an analysis of the PI Network’s price action based on technical indicators and market sentiment. It is important to note that cryptocurrency investments are subject to high market risk. The information presented here is for informational purposes only and should not be construed as financial advice. Investors are strongly advised to conduct their own thorough research and consult with a qualified financial advisor before making any investment decisions.