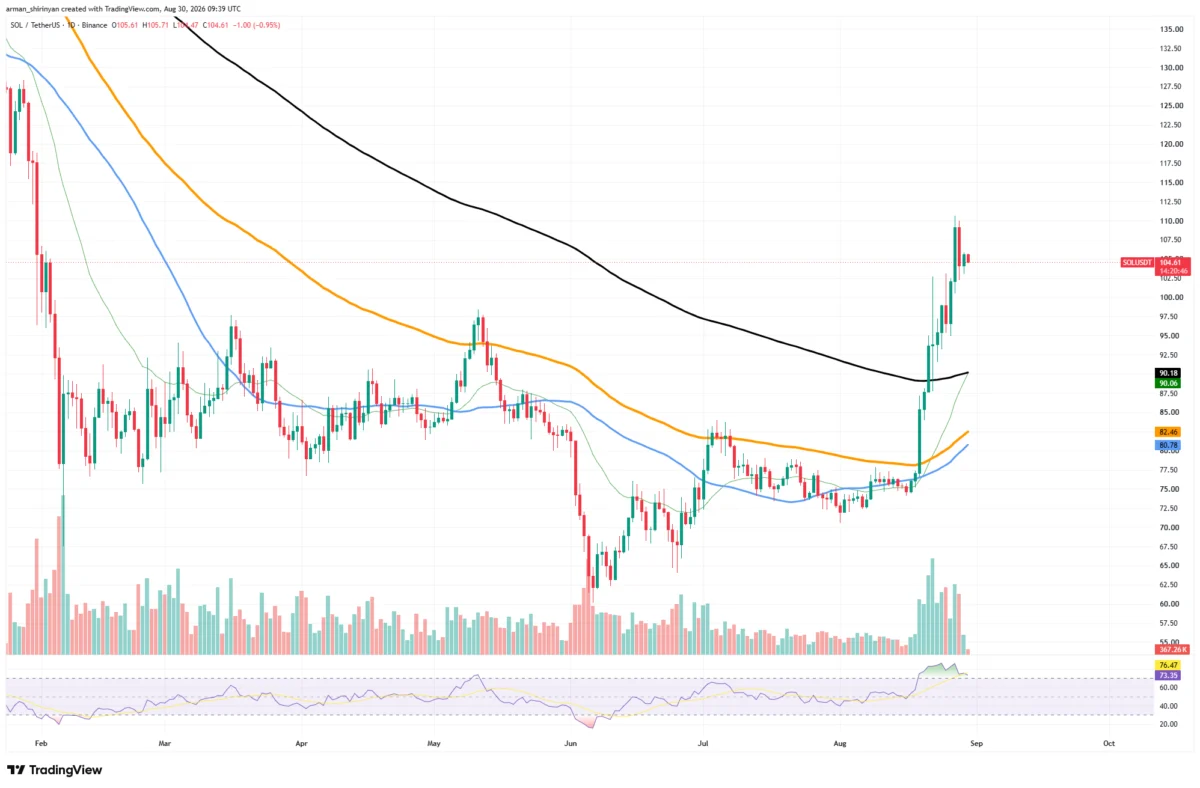
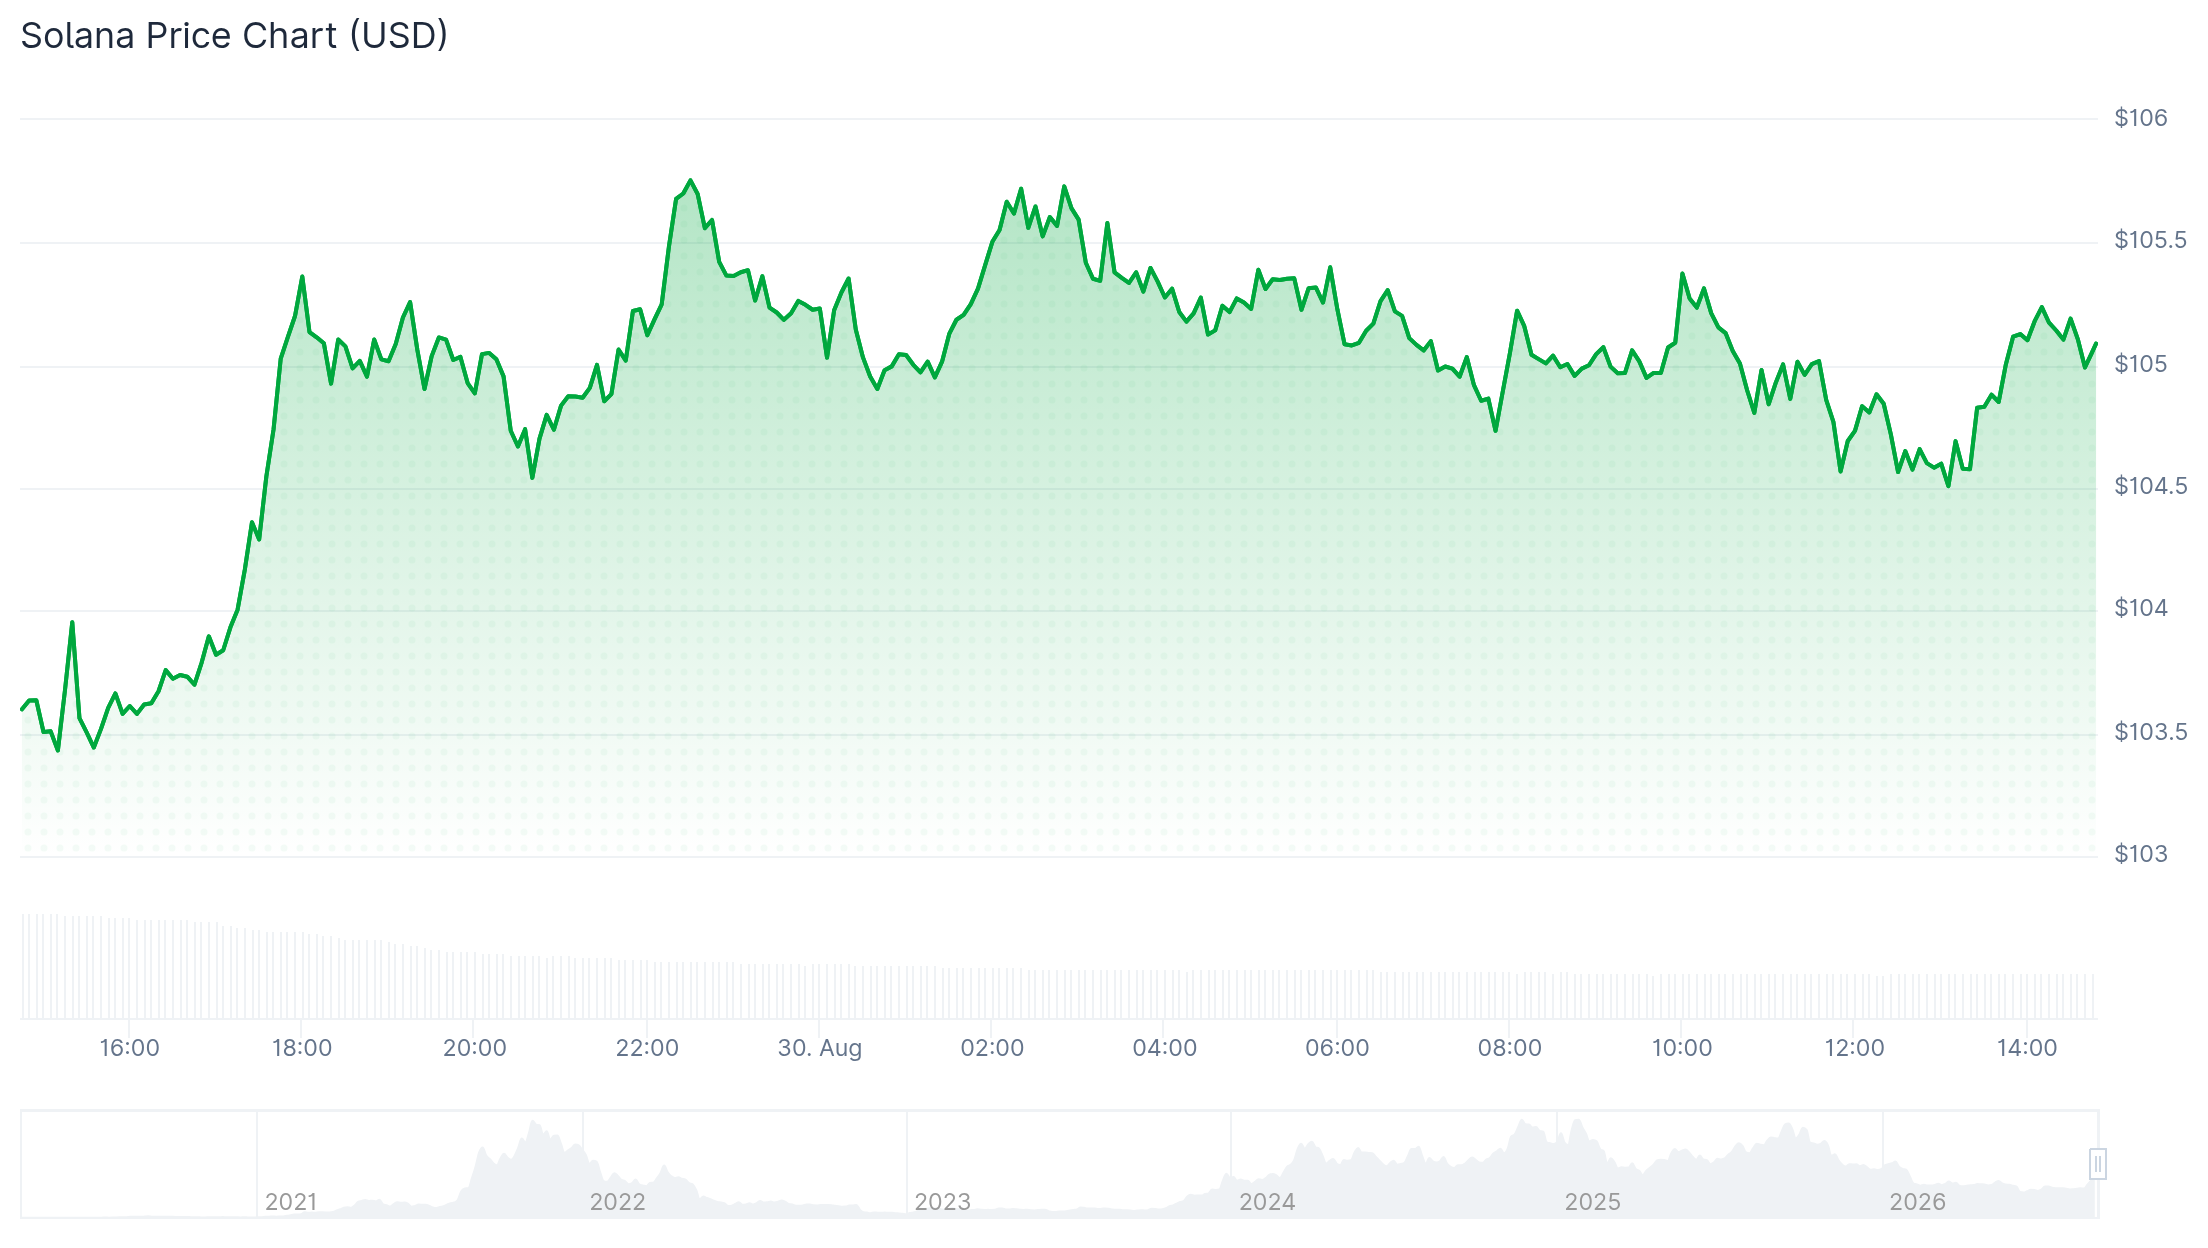
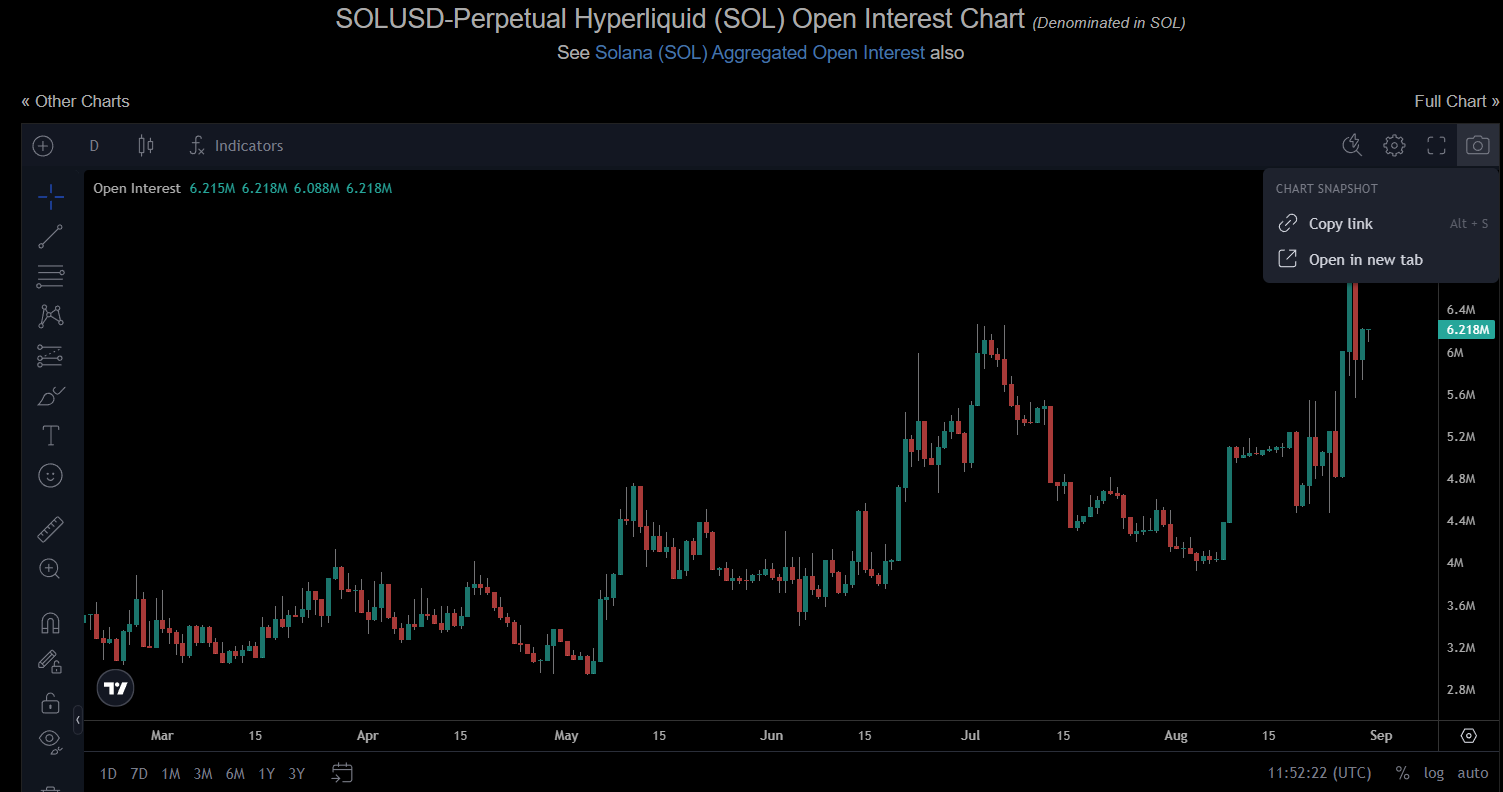
Solana (SOL) found itself trading near the $105.21 mark on Sunday, following a robust recovery throughout August that has notably drawn leveraged traders back into its derivatives market. This resurgence in activity has been particularly evident on platforms like Hyperliquid, where the SOL-USD perpetual contract registered a substantial open interest of $638.1 million, accompanied by a 24-hour trading volume exceeding $150.4 million. The cryptocurrency experienced a significant appreciation, advancing by 44.9% from its August 14 close of $75.34 to reach a peak of $109.18 by August 27, before slightly easing below the $110-$111 resistance zone. This period of rapid price action and increased speculative interest underscores a critical juncture for Solana, as market dynamics, characterized by high leverage and a distinct long bias, leave it particularly susceptible to rapid liquidations should price movements accelerate beyond established support or resistance levels, especially during periods of thinner trading liquidity such as weekends.
A Deeper Dive into Solana’s August Recovery
The month of August marked a pivotal period for Solana, witnessing a remarkable turnaround from earlier market stagnation. Beginning mid-month, SOL embarked on an upward trajectory, breaking through several key technical resistance points. This rally was not isolated; it occurred within a broader context of renewed optimism in the cryptocurrency market, often influenced by Bitcoin’s stability and intermittent surges. For Solana, the 44.9% climb from August 14th’s $75.34 to August 27th’s $109.18 signaled a significant shift in investor sentiment, moving from cautious optimism to outright bullish momentum. This recovery is particularly noteworthy given Solana’s tumultuous history, including its association with the FTX collapse in late 2022, which saw its price plummet and its ecosystem face considerable challenges. The ability to regain significant ground above key moving averages, such as the 50-day, 100-day, and 200-day, suggests a re-establishment of confidence among a segment of investors and traders.
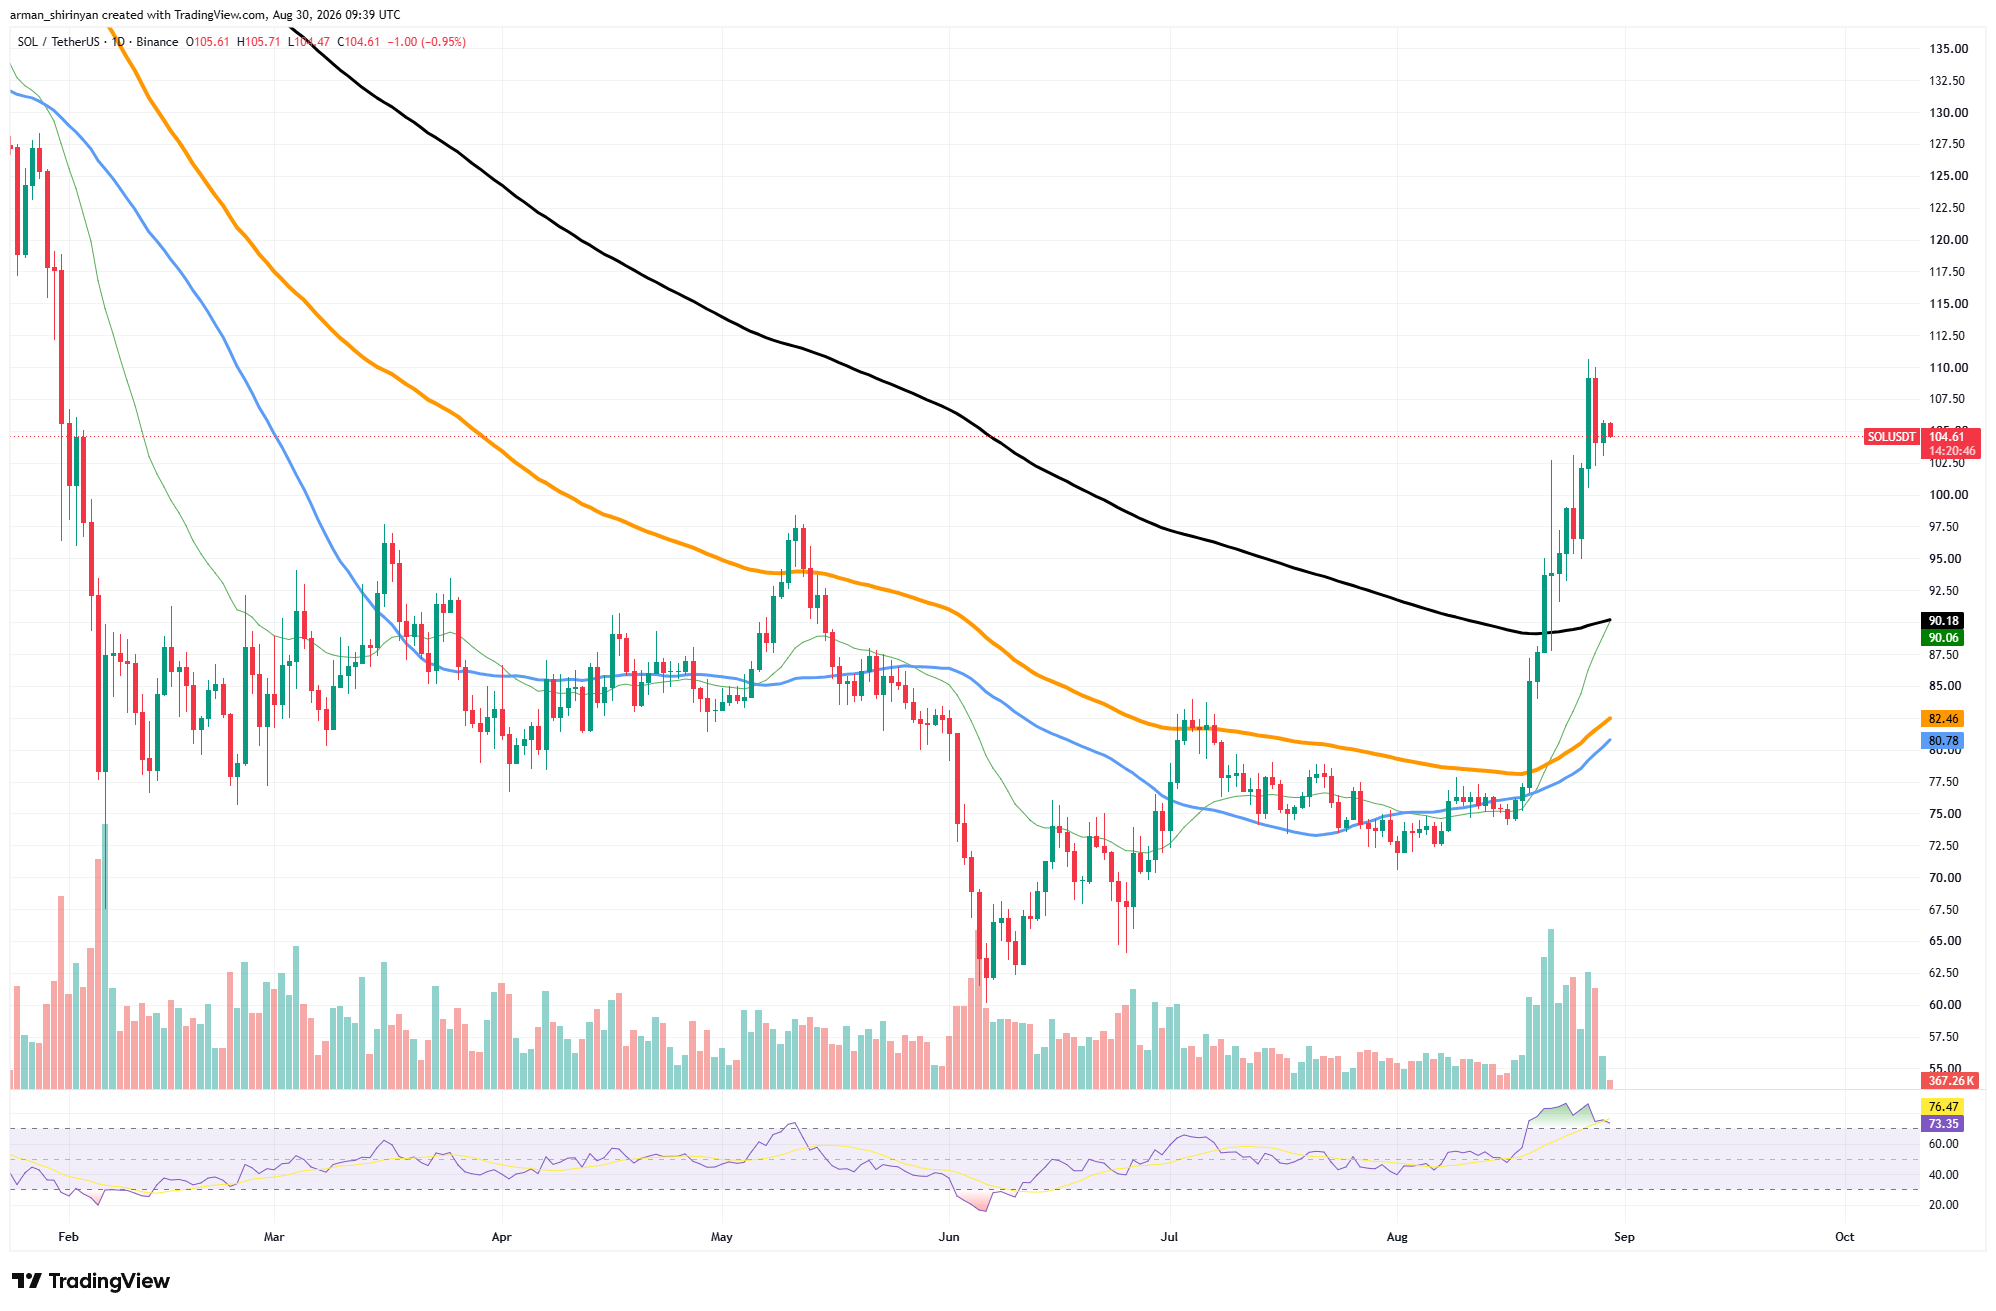
The initial breach of its 50-day moving average at $80.78 and the 100-day moving average at $82.46 served as early indicators of strengthening bullish sentiment. Subsequently, the cryptocurrency successfully navigated a more formidable cluster of resistance around the $90 mark, which included the 20-day exponential average at approximately $90.06 and the 200-day simple moving average near $90.18. The sustained breakout above these long-term indicators, accompanied by expanding trading volume, propelled SOL more than 15% above its 200-day average. This technical strength, coupled with the renewed interest from leveraged traders, highlights a market grappling with both significant upside potential and inherent volatility risks.

The Dynamics of Open Interest and Leveraged Whale Demand
Open interest, a crucial metric in derivatives markets, quantifies the total number of futures contracts that have not yet been closed or settled. A rise in open interest indicates an influx of new capital into the market, suggesting increased participation from both buyers and sellers initiating new positions. While a high open interest alone does not definitively signal a net bullish or bearish bias, its context within the broader market sentiment and funding rates can provide deeper insights.
Coinlyze data, referenced in the market analysis, highlighted Solana’s open interest on Hyperliquid specifically at $638.1 million. When considering a composite reading across various tracked venues, the total SOL futures exposure approached an impressive $2.31 billion. This distinction is vital; separating exchange-specific figures from the aggregated market total prevents misinterpretation of the overall market’s depth and liquidity. The substantial increase in open interest, particularly on a platform known for its perpetual contracts, underscores a heightened level of speculative engagement, as traders seek to capitalize on perceived price movements without owning the underlying asset directly.
Further scrutiny into whale tracking data revealed a significant imbalance in positioning among large holders. Out of 26 monitored wallets, 17 were observed holding long positions, while only nine were short. This translates to approximately 65.4% of these significant accounts betting on further price increases. Although this count differs slightly from a separately reported 71.2% account ratio, potentially due to variations in position weighting or methodological inconsistencies, the overall picture points to a clear and pronounced long bias among influential market participants. The average leverage employed by these long positions reached 18.94 times, marginally higher than the 17.22 times leverage for short positions. Such high leverage ratios amplify both potential gains and losses, making the market exceptionally sensitive to price fluctuations.
A notable instance of this leveraged whale activity involved one wallet, dormant for eight months, re-entering the market to acquire 76,856 SOL through Hyperliquid futures. This position, estimated to be worth $8 million, significantly contributed to the overall Solana open interest. While a single large trade does not establish a broad institutional trend, it exemplifies the conviction of some large-scale investors who perceive significant opportunities in Solana’s current valuation and trajectory. Such concentrated positions, particularly when highly leveraged, can act as accelerators for market movements, exacerbating volatility as they either get liquidated or contribute to a buying frenzy.
Funding Rates: A Neutral Indicator Amidst Bullish Aggression
In the context of perpetual futures contracts, funding rates serve as a mechanism to tether the contract price to the underlying asset’s spot price. Positive funding rates indicate that long position holders are paying short position holders, suggesting a predominantly bullish sentiment in the market. Conversely, negative funding rates imply shorts are paying longs, signaling a bearish bias.
During Solana’s recent surge, funding rates on Hyperliquid were observed to hover near zero, and at times even dipped into negative territory. This phenomenon is particularly intriguing given the overwhelming long bias and high leverage observed among traders. Typically, a crowded long position would lead to sustained positive funding rates as longs compete to maintain their positions. The neutral to slightly negative funding rate suggests that, despite the aggressive long positioning, traders were not consistently paying a large premium to hold their long positions. This scenario can reduce the immediate holding costs for leveraged longs, making it more attractive to maintain these positions over time.
However, the absence of a significant recurring long premium does not diminish the inherent liquidation risk. In fact, it might even encourage more aggressive leverage, falsely signaling a "cheaper" way to bet on Solana’s upside. Should the price experience a sudden and sharp decline, these heavily leveraged long positions would be forced to close, triggering a cascade of sell orders. This "long squeeze" or liquidation cascade can rapidly accelerate downward price movements, turning minor corrections into significant market downturns. Conversely, a confirmed upside breakout could trigger a "short squeeze," where short sellers are forced to cover their positions, adding mechanical buying pressure and further propelling the price upward. The neutrality of funding, therefore, acts as a deceptive calm before a potential storm, where the underlying high leverage remains a potent factor for extreme volatility.
Technical Levels and the Crowded Long Position Test
Solana’s price action throughout August has been characterized by a series of successful breaches of critical technical resistance levels, now transforming them into potential support zones. As previously noted, the SOL price decisively cleared its 50-day and 100-day moving averages, located at $80.78 and $82.46, respectively. Subsequently, it surpassed a more formidable technical confluence around $90, which included the 20-day exponential moving average at $90.06 and the 200-day simple moving average at $90.18. This sustained move above such significant long-term averages is generally interpreted by technical analysts as a strong bullish signal, suggesting a fundamental shift in market momentum.
The breakout was supported by an expanding trading volume, lending credibility to the move and indicating genuine buying interest rather than mere speculative spikes. However, the market’s current challenge lies in defending these newly established support levels. A successful retest, where the price dips to these former resistance zones and bounces back, would reinforce the bullish narrative, confirming that previous resistance has indeed become solid support.
Momentum indicators have also played a crucial role in assessing the sustainability of this rally. The Daily Relative Strength Index (RSI), which measures the speed and change of price movements, soared above 80 during the peak of the advance. An RSI reading above 70 typically signals an overbought condition, indicating that the asset may be due for a pullback or consolidation. While the RSI has since cooled to around 73.4, it still signals strong underlying demand. However, this elevated reading also suggests that buyers face increased risk near the recent peak, as the market could be extended.
From a technical perspective, immediate support for SOL is identified at $101.59, a level that holds a composite score of 78, indicating its significance. Maintaining this area is crucial for keeping the $105-$110 range within reach and for sustaining the bullish momentum. A definitive break above the $110-$111 resistance would shift market attention towards higher targets, potentially $115-$120. Conversely, a failure to hold $101.59 would expose lower support levels, first at $92.82, and then the critical $90 zone. A retest of the $90 zone, which encompasses the 20-day and 200-day moving averages, would be a litmus test for the durability of the current rally. A successful bounce from this area would solidify the argument that these long-term averages are now acting as robust support.
Broader Market Context and Implications
Solana’s performance in August cannot be fully appreciated without considering its broader market context and its unique position within the cryptocurrency ecosystem. Often touted as an "Ethereum killer" due to its high transaction throughput and low fees, Solana has been working to rebuild its reputation and infrastructure after a series of network outages and the fallout from the FTX collapse. The recent price recovery could be interpreted as a sign of renewed confidence in its technological capabilities and its burgeoning decentralized finance (DeFi) and non-fungible token (NFT) ecosystems. Developments within these sectors, such as new dApp launches or increased user adoption, often serve as fundamental drivers for SOL’s price.
The surge in open interest and the prevalence of leveraged long positions underscore the speculative nature of the current market environment. While such activity can fuel rapid price appreciation, it also introduces systemic risk. The concentration of highly leveraged bets means that even minor market corrections can trigger a domino effect of liquidations, exacerbating downward pressure. This vulnerability is particularly pronounced during periods of low liquidity, such as weekend trading hours, where smaller trade volumes can have disproportionately large impacts on price.
The confluence of technical breakouts, substantial open interest, and a dominant long bias creates a highly dynamic and potentially volatile scenario for Solana. Market participants, including both retail traders and institutional players, are closely watching these indicators. The ability of SOL to defend key support levels or break through significant resistance will largely determine its near-term trajectory. Hyperliquid futures funding rates and liquidation data will continue to be critical metrics, offering real-time insights into which side of the market—longs or shorts—is losing control and thereby influencing the immediate price action. As the cryptocurrency market continues to mature, the interplay between on-chain fundamentals, technical analysis, and derivatives market dynamics will remain central to understanding assets like Solana. The current setup for SOL presents a compelling case study of a high-stakes market, where opportunity and risk are intricately intertwined.