

The digital asset market, known for its rapid ascents and equally swift reversals, has once again provided a stark illustration of its inherent volatility with the recent trajectory of Pons. This cryptocurrency token, which made headlines for achieving an unprecedented $1 million in daily revenue for the first time in its brief operational history, has experienced a dramatic and precipitous decline, with its daily revenue plummeting to a mere fraction of that peak within a single month. This significant downturn, meticulously documented through on-chain analytics, reveals a complex interplay of intensifying market competition, evolving user demand, and the inherent structural vulnerabilities of certain decentralized finance (DeFi) models.
The Meteoric Rise and Precipitous Fall: An Overview of Pons’s Journey
Pons, launched on July 13, quickly established itself as a prominent bonding-curve launchpad on the burgeoning Robinhood Chain. For several weeks, it captured significant market attention and activity, riding the wave of enthusiasm surrounding new token launches and the rapid growth of its underlying blockchain. This period saw Pons reach remarkable financial milestones, with daily revenues exceeding $1 million, suggesting a robust and rapidly expanding ecosystem. However, this impressive growth proved unsustainable, as evidenced by a comprehensive analysis of its core metrics.
The sharp contraction in Pons’s performance is not an isolated anomaly but rather a clear indication of broader challenges confronting projects heavily reliant on speculative trading and an undifferentiated service offering in a fiercely competitive landscape. The observable data points to a systemic demand problem that has permeated every facet of the project, from token creation to trading volume and, ultimately, revenue generation. This rapid reversal underscores the critical importance of sustainable business models, genuine utility, and robust competitive advantages in the volatile world of blockchain technology and digital assets.
A Detailed Look at the Data: Unpacking the Decline
To understand the scale and nature of Pons’s decline, a granular examination of its key performance indicators (KPIs) is essential. Data extracted from Pons’s own analytics dashboard on Dune, a platform renowned for its on-chain data visualization, paints a clear and consistent picture across multiple metrics since the project’s inception. These charts reveal a synchronized rise and fall, suggesting a fundamental shift in market dynamics rather than an isolated operational issue.
Three primary metrics tracked by the dashboard — daily tokens created, daily token volume, and daily revenue — all tell a convergent story of rapid growth followed by an equally rapid contraction.
-
Daily Tokens Created: This metric, a fundamental indicator of new project launches and user engagement on the platform, peaked dramatically at 36,449 tokens created in a single day. This apex, occurring approximately six weeks into the project’s life, represented the highest bar on its entire operational timeline. However, in the most recent reporting days, this figure has plummeted to a range of 6,000 to 7,600 tokens daily. This constitutes a substantial decline of nearly 80% from its all-time high, signaling a significant reduction in the rate of new projects being launched on the Pons platform or a decrease in the activity associated with these launches.

-
Daily Token Volume: Mirroring the trajectory of token creation, daily token volume on Pons exhibited an almost identical shape. Its peak bar soared beyond the $800 million gridline, approaching an estimated $900 million in trading activity within a single 24-hour period. This represented a substantial flow of capital through the platform, indicative of high investor interest and trading speculation. Subsequently, this volume has sharply receded to a recent range of approximately $100 million to $190 million per day. This decline, representing an 80-89% drop from the peak, directly impacts the platform’s ability to generate fees from trading activity.
-
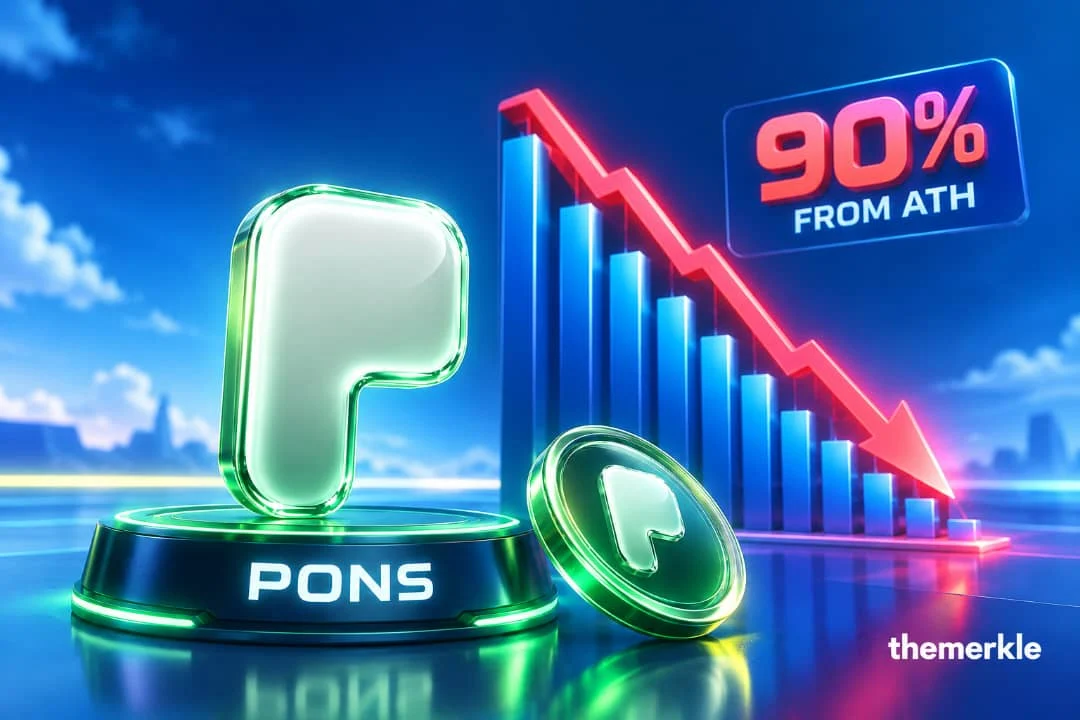
Daily Revenue: The metric of paramount interest, daily revenue, also followed this alarming trend. Having briefly surpassed the $1 million mark, and peaking just above the $8 million gridline on the charts, it has since collapsed towards a recent daily range of roughly $1 million to $2 million. This represents a staggering decline of over 75% from its peak total revenue. More critically, the protocol revenue specifically, which represents the direct earnings of the Pons protocol after distribution, shows an even steeper proportional contraction. This darker shaded band, layered beneath the total revenue bars, has shrunk at an accelerated pace, aligning with reports of a 90% drop in PONS protocol revenue from its all-time high. This specific figure is crucial as protocol revenue directly fuels the project’s sustainability and its tokenomics mechanisms.
The synchronicity of these declines — in tokens created, trading volume, and total revenue — is a critical observation. They did not fall independently but rather in lockstep, having also risen together during the same six-week window. This interconnectedness strongly suggests that the issue is not a revenue-specific problem stemming from pricing or fee structure adjustments, but rather a pervasive demand problem that has impacted the entire ecosystem built upon the Pons platform. When overall interest and activity on the underlying Robinhood Chain cooled, the effects were immediately and disproportionately felt by applications like Pons, which thrive on such momentum.
Chronology of Key Events: A Timeline of Growth and Contraction
- July 13: Pons officially launches on the Robinhood Chain, introducing its bonding-curve launchpad model to the market.
- Late July: Rival launchpad Noxa ceases accepting new launches, leading to a temporary consolidation of activity onto Pons, which absorbs the displaced market share within days, contributing to its early growth.
- August: Pons experiences its period of peak activity, with daily token creation, trading volume, and revenue soaring to unprecedented levels, culminating in daily revenue exceeding $1 million and peaking around $8 million. The Robinhood Chain itself reports record daily activity during this period, directly correlating with Pons’s success.
- August (Mid-to-Late): Uniswap, a decentralized exchange giant with significant brand recognition and distribution, launches its own launchpad functionality on the Robinhood Chain. This new competition immediately impacts Pons’s market share and activity.
- Early September: While daily token creation, trading volume, and revenue begin their rapid decline from late August peaks, the PONS token price paradoxically reaches its all-time high of $0.97 on September 5. This divergence is largely attributed to the initial momentum of its token burn mechanism, which was fueled by earlier high protocol revenues.
- Mid-to-Late September: The full impact of competition and cooling demand becomes evident, with daily tokens created, volume, and revenue plummeting by 75-90% from their peaks. The burn mechanism also begins to slow down proportionally with the reduced protocol revenue.
Competition Arrived Fast and Took Share: The Shifting Landscape
One of the most direct and impactful explanations for Pons’s rapid decline is the swift arrival of formidable competition. The decentralized finance space is characterized by low barriers to entry for new protocols and an even lower barrier to exit for users, leading to intense competition for liquidity and user activity. Pons had benefited from this dynamic once before when a rival launchpad, Noxa, ceased operations in July, allowing Pons to quickly absorb the displaced user base and launch activity. This event contributed significantly to Pons’s initial surge in popularity and revenue.
However, the market’s loyalty proved to be exceptionally thin. In August, Uniswap, a behemoth in the DeFi ecosystem with unparalleled brand recognition, extensive distribution networks, and a long-standing reputation, launched its own launchpad offering on the Robinhood Chain. Uniswap’s entry was not merely a new competitor; it was a market-defining event that immediately challenged Pons’s position as the default launch venue. The impact was almost instantaneous, demonstrating how quickly market share can evaporate when a well-established player enters a nascent or rapidly growing niche. Uniswap’s ability to "out-launch" Pons on its very first day of operation on the Robinhood Chain underscores the power of brand and existing user bases in attracting new activity.
This competitive dynamic highlights a core vulnerability inherent in many launchpad models. Being the "default venue" is a precarious position that holds only until a larger, more recognized, or more innovative player enters the arena with a similar product. The ease with which users and projects can migrate from one platform to another in the DeFi space means that competitive advantages based solely on early market entry or temporary absence of rivals are inherently fragile.
The ‘Graduation’ Conundrum: Volume Versus Value

Beyond external competition, a deeper structural issue within Pons’s operational model appears to have contributed to its unsustainable growth and subsequent decline: the disconnect between the sheer volume of new token launches and the actual long-term value generated.
Pons, like many bonding-curve launchpads, facilitates a high volume of token creations. Reported lifetime launch counts on Pons range widely, from approximately 124,000 to over 500,000 depending on the source. While these figures might initially suggest a thriving ecosystem, a critical detail emerges: only about 1% of these launches ever reach "graduation." Graduation, in this context, signifies the point at which a token clears a predefined liquidity threshold, allowing it to trade normally on the open market.
Crucially, the platform’s own documentation explicitly states that graduation is not necessarily a quality signal. This admission is highly significant. It implies that a vast majority of tokens launched on Pons never achieve sufficient liquidity or sustained interest to become viable trading assets. Instead, they likely represent short-lived speculative endeavors or even "rug pulls" that quickly lose all value.
This matters immensely because the revenue model of a bonding-curve launchpad is not solely dependent on the initial creation of tokens, but rather on the sustained trading activity that occurs both before and after graduation. The dashboard’s own daily-tokens-created chart corroborates this; the massive spike to 36,449 tokens in a single day was not matched by a proportional or lasting rise in revenue once that initial burst of activity subsided. Most of this activity generated a fleeting surge of early trading fees and then quickly went quiet. This pattern is precisely what one would expect from a market driven by a constant "new-token mania" that, by its very nature, is unsustainable and eventually cools. The lack of genuine "graduation" success indicates that Pons was primarily facilitating short-term speculative plays rather than fostering long-term, viable projects with sustained trading interest.
Treasury Mechanics Under Pressure: The Burn Rate’s Dependence
Pons employs a tokenomic model that relies on a deflationary mechanism: a significant portion of its protocol fee revenue is channeled into buying back and burning PONS tokens from the open market through its Treasury. As of early September, this mechanism had reportedly burned approximately 288 million tokens, representing about 29% of the token’s initial one billion total supply. This aggressive burn strategy was a major factor in driving the PONS token price to its all-time high of $0.97 on September 5, even as the underlying volume and revenue charts had already begun their descent from late-August peaks. The narrative of increasing scarcity, fueled by the burn, provided a temporary buffer for the token’s market price.
However, this "flywheel" mechanism is inherently dependent on a consistent and robust stream of protocol revenue. The problem is self-evident: when protocol revenue slows down, the buyback engine slows down commensurately. Less daily revenue translates directly into smaller buybacks, which in turn leads to a slower burn rate. This deceleration in the burn mechanism directly undermines the scarcity narrative that was a primary driver of the PONS token’s price appreciation. The interconnectedness of revenue and price support in this model creates a double-edged sword: high revenue drives price appreciation through scarcity, but a decline in revenue quickly reverses this effect, potentially accelerating a downward spiral. This highlights the fragility of tokenomics models that are heavily reliant on continuous high-level activity.
Broader Implications for Decentralized Launchpads and Speculative Markets
The trajectory of Pons offers valuable insights into the broader economics of decentralized launchpads, particularly those utilizing bonding-curve models, and the highly speculative segments of the cryptocurrency market.

-
Responsiveness to Market Narratives: Pons exemplifies how such platforms are extremely responsive to the prevailing "hot" chain or market narrative of a given moment. Its peak performance coincided precisely with a period of record daily activity on the Robinhood Chain, indicating a direct correlation. When chain-wide activity experiences even a slight cooling, a launchpad that captures a percentage of that activity feels the impact immediately and disproportionately. All three of Pons’s core metrics — token creation, volume, and revenue — falling in lockstep serves as a powerful illustration of this sensitivity.
-
Vulnerability to Competition: The ease with which Uniswap disrupted Pons’s dominance underscores the critical need for sustainable competitive advantages beyond mere first-mover status. In a market where capital and users can migrate with minimal friction, brand recognition, established ecosystems, and genuine product differentiation become paramount.
-
The Illusion of Volume: The high volume of token creations on Pons, contrasted with the low "graduation" rate and the platform’s own admission about graduation not being a quality signal, reveals a fundamental challenge. Many launchpads can generate impressive raw numbers of new tokens or initial trading bursts, but if these do not translate into viable, long-term projects with sustained utility and liquidity, the revenue generated becomes fleeting and unsustainable. This suggests that investors need to look beyond headline activity figures and scrutinize the quality and longevity of projects launched on such platforms.
-
Valuation Challenges in Volatile Markets: Even after its significant revenue decline, the PONS token was reportedly trading at a multiple of its trailing annualized protocol revenue that remained higher than that of its closest peer. This suggests a potential overvaluation, where the market price had not yet fully adjusted to the dramatic drop in the project’s underlying earnings power. A 90% drop in daily revenue without an equivalent, or even steeper, drop in that valuation multiple leaves the token looking expensive relative to its current earning capabilities. This lag in price adjustment can create significant risks for investors who base their decisions on historical peaks rather than current fundamentals.
-
Sustainability of Tokenomics: The reliance on a buyback and burn mechanism, while initially effective in driving price appreciation through perceived scarcity, is ultimately beholden to the health of the protocol’s revenue stream. When that stream falters, the deflationary narrative weakens, and the price support mechanism is compromised. This highlights the importance of diversified and robust tokenomics that can withstand periods of reduced activity.
In conclusion, the rapid ascent and subsequent steep decline of Pons serve as a critical case study for the DeFi space. It underscores the intense competitive pressures, the inherent volatility of speculative markets, and the importance of resilient business models that can generate sustained value beyond fleeting trends and new-token manias. For participants in this ecosystem, the Pons experience is a powerful reminder that robust fundamentals, genuine utility, and a strong competitive moat are essential for long-term viability, even in the most rapidly growing sectors of the digital economy.
Disclosure: This article is for informational purposes only and does not constitute trading or investment advice. Always conduct thorough research before engaging in any cryptocurrency investments or services.