


As the calendar turns to October, the cryptocurrency market ushers in what is colloquially known as "Uptober," a period historically associated with robust upward price movements for Bitcoin and other digital assets. This transition follows a September that, contrary to its notorious moniker "Red September," proved surprisingly resilient for Bitcoin, culminating in a respectable gain despite a late-month correction. The leading cryptocurrency now faces a complex interplay of historically bullish seasonal trends, persistent macroeconomic tightening, and dynamic institutional interest, setting the stage for a potentially volatile and closely watched month.
September’s Surprising Resilience: Defying the "Red September" Curse
September has long held a formidable reputation within crypto circles as "Red September," a month historically marked by significant price declines for Bitcoin. Since 2013, data from platforms like CoinGlass reveal that September has yielded negative returns for Bitcoin in the majority of years, with an average decline often cited in double-digit percentages. This historical trend is often attributed to a confluence of factors, including the traditional end of summer trading lulls, institutional portfolio rebalancing ahead of the fourth quarter, and general market uncertainty.
However, September 2026 presented a notable deviation from this established pattern. Bitcoin commenced the month at a challenging juncture, yet steadily built momentum. For much of the month, Bitcoin was on track to record its best September performance in history, momentarily surpassing the 7.29% gain seen in September 2024. Despite a late-stage correction that shaved some of its gains, Bitcoin ultimately closed September with a commendable 6.33% increase. This positive monthly close not only defied the "Red September" curse but also underscored a underlying strength in the market, even if it fell short of setting a new historical record for the month. The ability of Bitcoin to maintain a green candlestick in a historically bearish month signals a potential shift in market dynamics or a strong underlying demand that can overcome seasonal pressures.
The Allure of "Uptober": Historical Performance and Current Expectations
With September’s challenges navigated, market attention now pivots sharply to October, or "Uptober," a term crypto enthusiasts use to reflect the month’s historically stellar performance. Since 2013, October has delivered an average return of 19.92% for crypto investors, with a median return of 14.71%, according to CoinGlass. These figures highlight October as one of the most consistently bullish months for Bitcoin, often acting as a springboard for year-end rallies. This pattern is frequently linked to renewed institutional interest as trading desks return to full capacity after summer holidays, anticipation of year-end bonuses, and a general increase in risk appetite as investors look to position themselves for potential Q4 growth.
However, historical performance is not a guarantee of future results, and last year served as a stark reminder of this axiom. October 2025 bucked the trend, closing down 3.69%, marking only the third "red" October since 2013. This anomaly underscores the importance of considering current market conditions rather than solely relying on historical averages.

Bitcoin began October 2026 trading at approximately $83,823, showing a modest 0.28% gain on the first day. This starting point positions Bitcoin in a high-value range, considerably above its levels for much of the past year. The key question for market participants is whether the inherent bullish sentiment of "Uptober" will materialize this year, or if prevailing macroeconomic headwinds will exert a stronger influence, leading to another deviation from the historical norm.
Macroeconomic Landscape: The Federal Reserve’s Tightening Grip
The broader macroeconomic environment presents a significant counter-narrative to the bullish seasonal expectations for Bitcoin. Global financial markets, including cryptocurrencies, remain highly sensitive to monetary policy decisions, particularly those emanating from the U.S. Federal Reserve.
On September 16, the Federal Reserve raised its benchmark interest rate by 25 basis points, pushing the federal funds rate to a new range of 3.75% to 4%. This was the first rate hike since July 2023, and notably, the decision was unanimous among the Federal Open Market Committee (FOMC) members. The rationale behind these hikes, as articulated by Fed Chair Kevin Warsh, is the persistent elevation of inflation. While August’s Personal Consumption Expenditures (PCE) inflation—the Fed’s preferred inflation gauge—came in cooler than forecast at 3.4% annually (against an expected 3.7%), with core PCE at 3.0% (against 3.3%), it still remains above the Fed’s long-term target of 2%. The Fed’s median projection indicates a strong likelihood of at least one more 25-basis-point hike before the end of the year, with the next decision scheduled for October 28.
Rising interest rates inherently increase the cost of borrowing and make "cheap money" scarcer. This environment typically encourages investors to rotate out of higher-risk, non-yielding assets like Bitcoin and into safer, yield-bearing instruments such as U.S. Treasuries. The bond market has already reacted decisively to the Fed’s hawkish stance. By the end of September, the 10-year Treasury yield climbed to 5.289%, and the 30-year Treasury yield reached 5.632%, both marking 52-week highs. These elevated yields represent a significant opportunity cost for holding assets that do not generate income, placing direct competitive pressure on Bitcoin.
Traditional stock markets have also reflected this caution. Both the S&P 500 and the Dow Jones Industrial Average registered monthly losses in September as bond yields ascended, signaling broader investor apprehension regarding tighter monetary conditions and their potential impact on corporate earnings and economic growth. The interconnectedness of global financial markets means that a downturn in traditional equities often correlates with a similar trend in risk assets like Bitcoin, albeit with higher volatility.
Institutional Engagement: Bitcoin ETFs and Their Evolving Impact
A relatively new but increasingly influential factor in Bitcoin’s market dynamics is the performance of spot Bitcoin Exchange Traded Funds (ETFs). Since their inception, these investment vehicles have provided a regulated and accessible pathway for institutional and retail investors to gain exposure to Bitcoin without directly holding the asset.
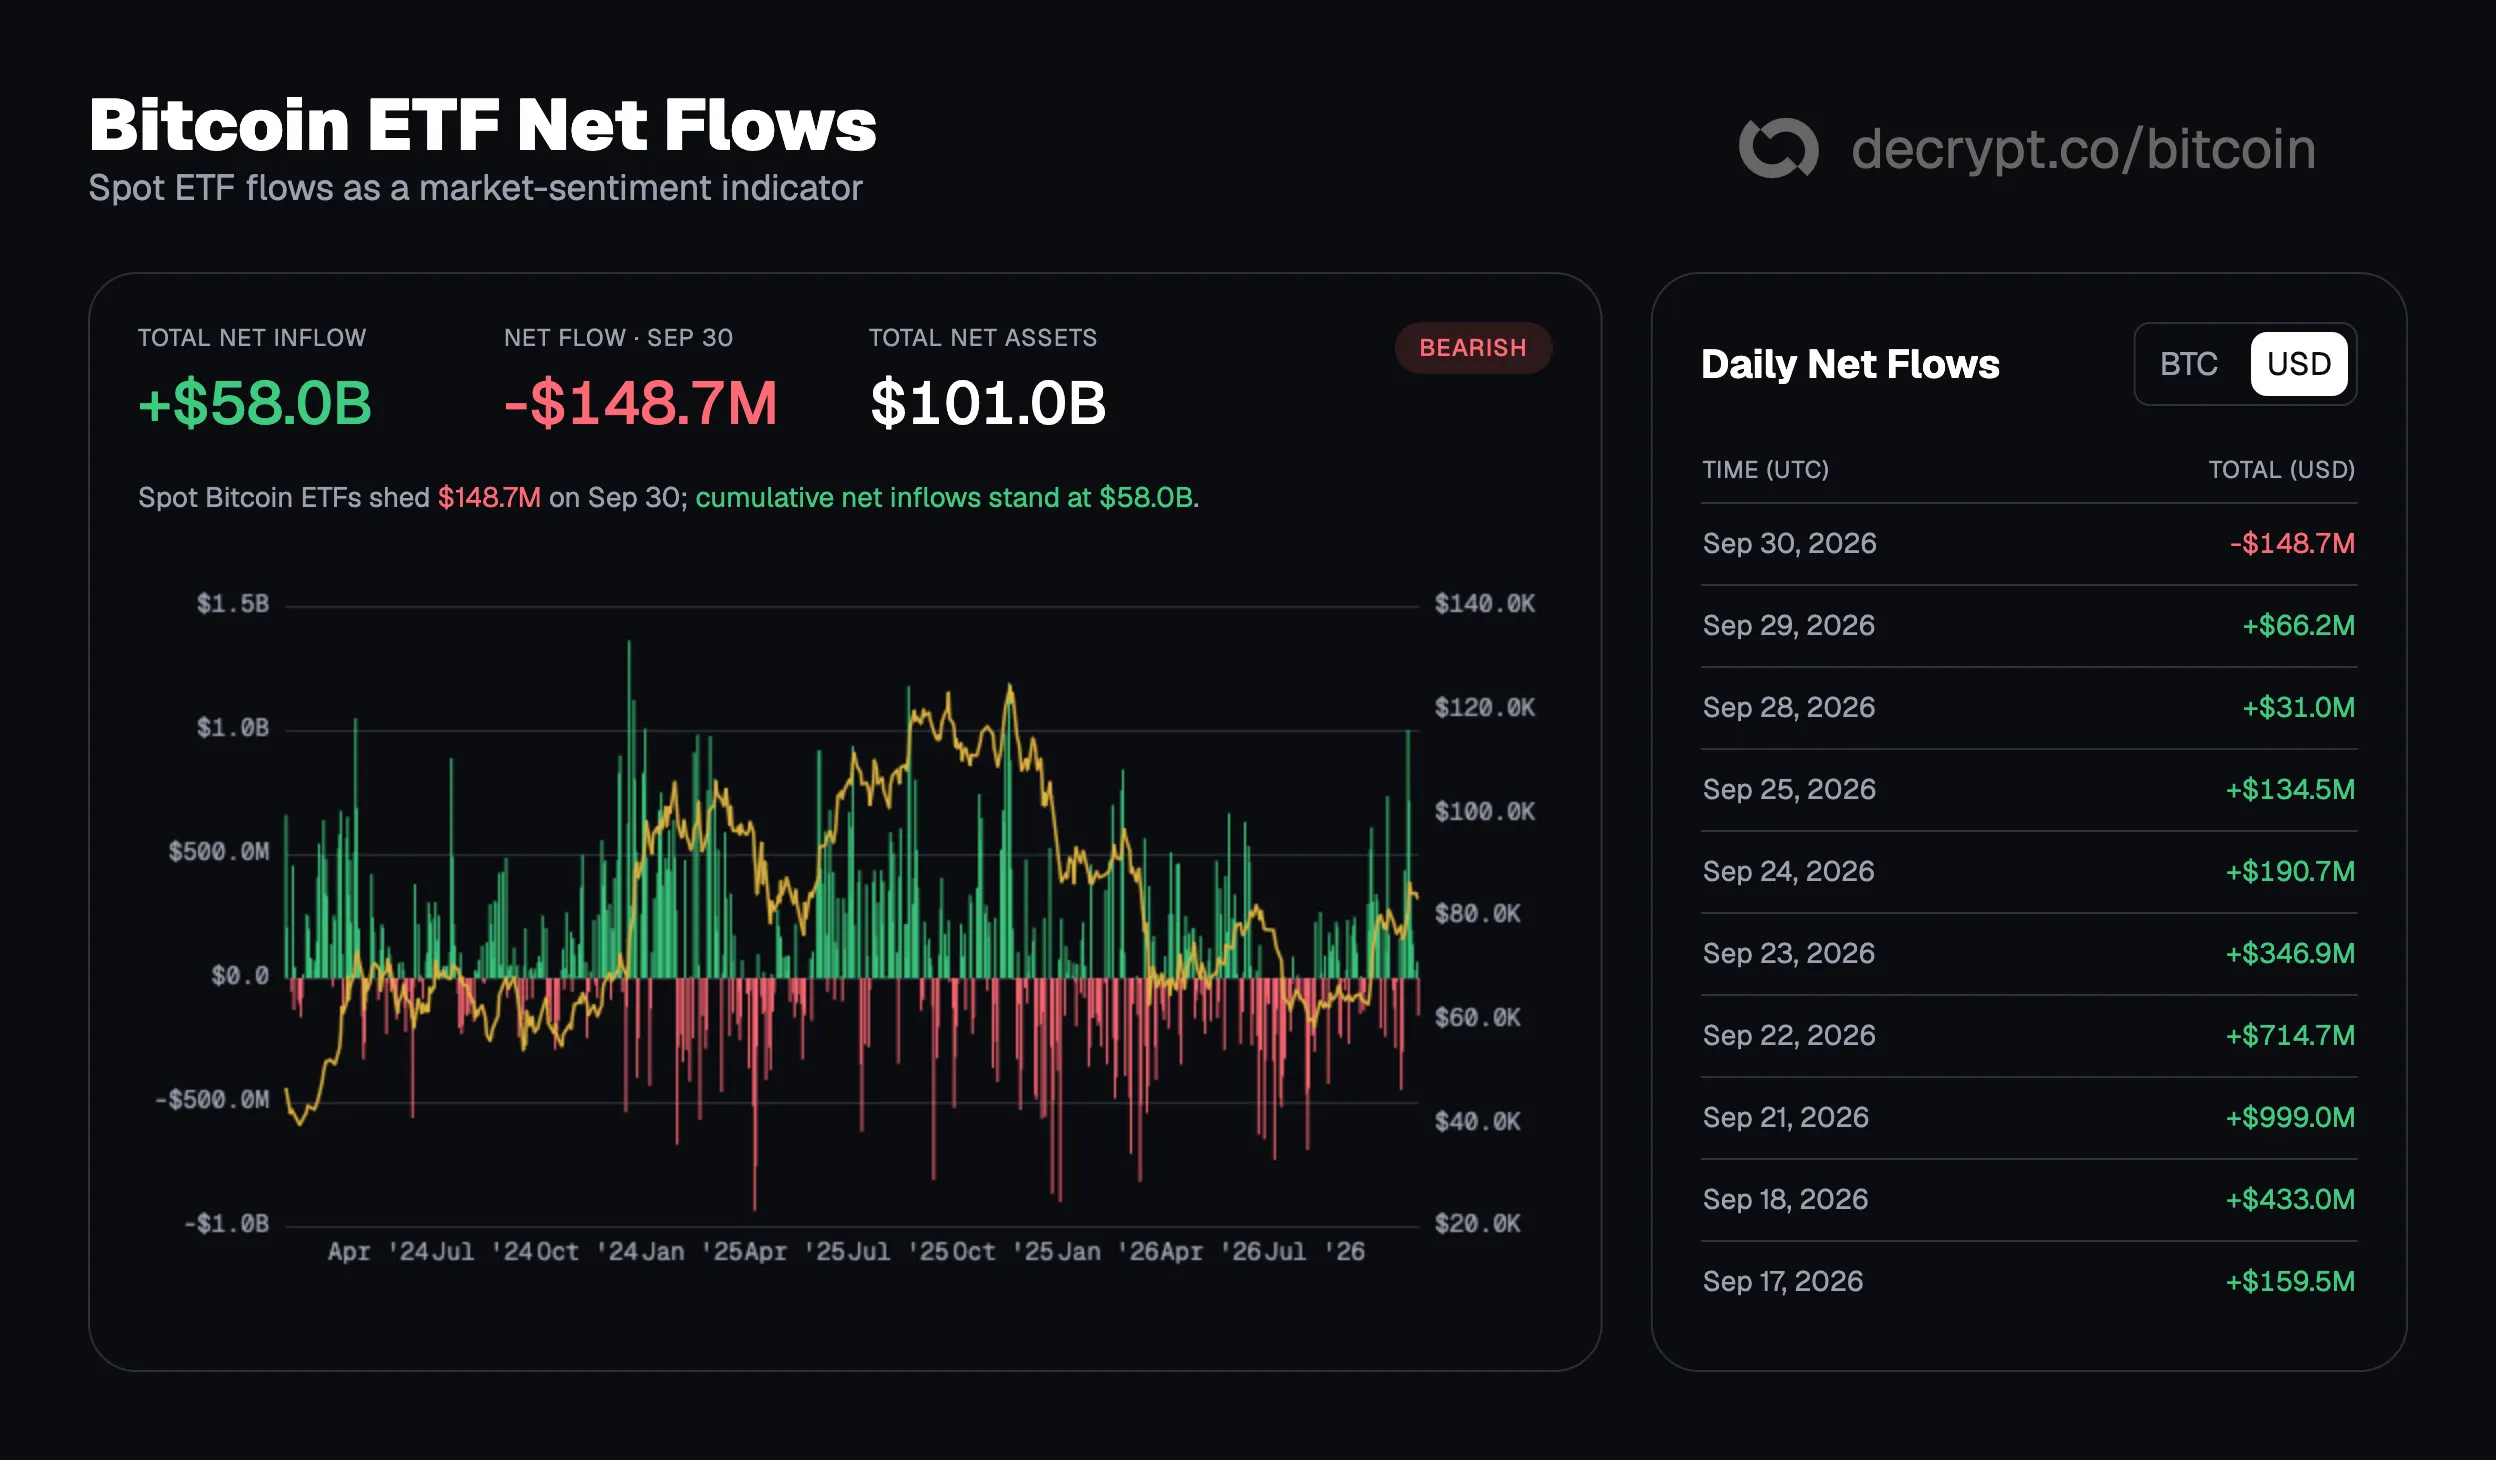
In the lead-up to October, Bitcoin ETFs demonstrated remarkable strength, attracting approximately $3.08 billion in net inflows over a nine-day consecutive streak that concluded on September 29. This sustained influx of capital underscored robust institutional demand and a bullish sentiment among a segment of traditional finance. Notably, one trading day within this period saw nearly $1 billion in inflows, indicating significant conviction.
However, this impressive streak was interrupted on September 30, with Bitcoin ETFs recording $148.69 million in net outflows, according to Decrypt’s Bitcoin ETF tracker. While a single day of outflows might not signify a long-term trend reversal, it does highlight the sensitivity of these funds to market sentiment and profit-taking. Despite this recent dip, the total net assets under management (AUM) across all Bitcoin ETFs remain substantial, exceeding $101 billion, though precise figures can vary slightly between tracking sources. The week of September 21, for instance, alone pulled in roughly $2.4 billion, demonstrating the sheer scale of capital flowing into these products. As October begins, the current week has seen net outflows totaling $51.42 million so far, suggesting that the initial surge of institutional buying might be moderating, or investors are exercising caution in light of the macro environment.
The long-term implications of Bitcoin ETFs are profound. They have legitimized Bitcoin as an asset class for a broader audience, fostering greater liquidity and potentially reducing price volatility over time. However, their daily flow dynamics also introduce a new layer of influence on Bitcoin’s price, as large institutional movements can significantly impact supply and demand in the spot market.
Technical Analysis: A Snapshot of Bitcoin’s Price Momentum
From a technical perspective, Bitcoin’s current price action around $83,823.14 suggests a strong underlying trend, albeit with a recent pause in its upward advance. The daily candlestick opened at $83,588.27 and has traded within a range of $83,134.08 to $84,360.88, indicating a period of consolidation following a pullback from a swing high of $87,354.33. This high itself was achieved after a rebound from $74,977.57, establishing a clear pattern of higher lows and higher highs leading into October.
Several key technical indicators provide further insights into the market’s current state:
- Average Directional Index (ADX): The ADX, which measures the strength of a trend regardless of its direction, currently reads 41.5. A reading above 25 is generally considered confirmation of a strong, established trend. The fact that the positive directional line (+DI) is above the negative directional line (-DI) signifies that buyers are currently in control and driving this trend, rather than sellers. This suggests that despite the recent consolidation, the underlying bullish momentum remains robust.
- Exponential Moving Averages (EMAs): EMAs give more weight to recent prices, making them more responsive to current market action. The 50-day EMA positioned above the 200-day EMA is a classic "golden cross" signal, indicative of a short-term trend being stronger than the long-term trend, and is widely interpreted as a bullish indicator. This crossover confirms the upward trajectory observed in recent price action.
- Relative Strength Index (RSI): The RSI, a momentum oscillator that measures the speed and change of price movements, stands at 61.8. An RSI reading between 50 and 70 typically suggests that bulls are in charge without the asset being in overbought territory (above 70), where profit-taking often begins. This indicates healthy buying pressure with room for further upside before exhaustion.
- Squeeze Momentum Indicator: This indicator is currently "off," implying that the volatility compression (often preceding a significant price move) has already been released. This suggests that the market may have already absorbed recent movements and is either consolidating or preparing for another directional move without significant immediate pressure building up.
- Bollinger Bands: Bollinger Bands, which measure price volatility and identify overbought or oversold conditions relative to a moving average, are observed to be expanding. Expanding bands typically suggest increasing volatility and the potential for a strong directional move. This could either fuel further upside if the bullish trend continues or exacerbate a downside move if market sentiment shifts.
Combined, these technical indicators paint a picture of a market with strong underlying bullish momentum, currently in a phase of consolidation, but with potential for renewed volatility.
Market Sentiment and Prediction Markets: Gauging Trader Expectations
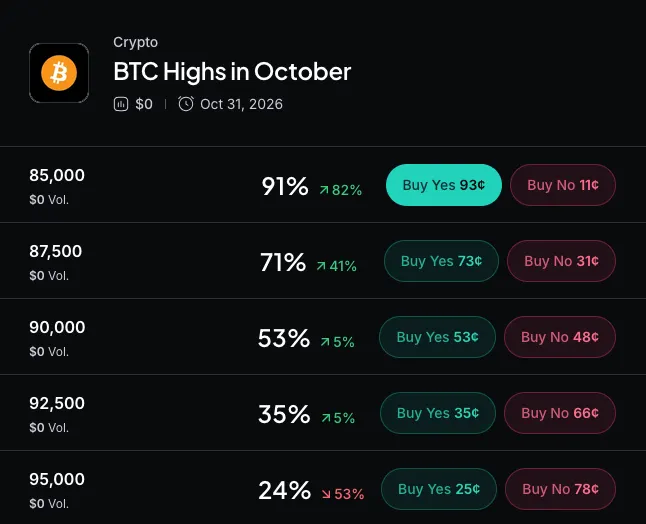
Beyond technical charts, market sentiment provides a crucial lens through which to view Bitcoin’s immediate future. Prediction markets, such as Myriad (built by Decrypt’s parent company, Dastan), offer a unique insight into collective trader expectations by allowing participants to bet on future outcomes.
On Myriad, traders are currently placing approximately 90% odds on Bitcoin reaching a high of $85,000 within October. This indicates a strong consensus that at least a modest upward movement is highly probable, suggesting that traders anticipate Bitcoin will at least maintain its current levels or see a slight appreciation. The next tier, hitting $87,500, is given a 70% chance, implying significant confidence in further upside, albeit with slightly more caution than the $85,000 target. The safest bet, according to Myriad’s current odds, is that BTC remains relatively flat, underscoring the mixed signals from macro and technical factors.
However, the longer-term outlook on these platforms is considerably more conservative. In a separate market on Myriad, traders assign a mere 7% probability that Bitcoin will set a new all-time high before 2027. This suggests that while near-term gains are expected, a monumental surge of approximately 50% from current levels to surpass previous peaks is viewed as highly unlikely in the coming months, highlighting a pragmatic view of current market conditions and the significant hurdles Bitcoin would need to overcome.
Key Catalysts and a Packed October Calendar
The trajectory of Bitcoin in "Uptober" will undoubtedly be shaped by a series of high-impact economic events scheduled throughout the month. Investors and traders will be closely monitoring these announcements for signals that could either reinforce or undermine the bullish seasonal narrative.
- October 2: September Jobs Report. The release of the U.S. jobs report is a critical economic indicator, providing insights into the health of the labor market. A strong jobs report could signal continued economic robustness, potentially giving the Fed more leeway to continue its tightening policy, which might be bearish for risk assets. Conversely, a weaker report could suggest economic cooling, potentially leading the Fed to reconsider future hikes, which could be bullish for Bitcoin.
- October 7: FOMC Minutes. The minutes from the Federal Open Market Committee meeting offer a detailed look into the discussions and considerations that led to the September rate hike. Traders will scrutinize these minutes for any dovish or hawkish nuances, potential divisions among members, or explicit forward guidance on future monetary policy.
- October 14: Consumer Price Index (CPI). The CPI report is a key measure of inflation. A higher-than-expected CPI reading would likely reinforce the Fed’s hawkish stance, potentially leading to further rate hike expectations and downward pressure on Bitcoin. A lower-than-expected reading, conversely, could alleviate inflation concerns and provide a tailwind for risk assets.
- October 28: Federal Reserve Interest Rate Decision. This is arguably the most significant event of the month. The market will be keenly watching whether the Fed implements another 25-basis-point hike, as currently projected, or if any new economic data prompts a change in their decision. Any deviation from expectations could trigger substantial market volatility across all asset classes, including Bitcoin.
- October 31, 11:59 p.m. ET: Myriad’s October Market Closes. The closure of these prediction markets will reveal the final consensus of traders on Bitcoin’s performance for the month.
Broader Implications and Future Outlook
Bitcoin’s performance in October 2026 will serve as a crucial barometer for the broader cryptocurrency market. The convergence of a historically bullish "Uptober" trend with significant macroeconomic headwinds creates a complex and potentially volatile environment. While the resilience shown in September and the institutional inflows into ETFs provide a foundation of optimism, the Federal Reserve’s continued tightening cycle and the rising bond yields present formidable challenges.
The market is currently caught between the traditional bullish seasonality and the stark reality of higher interest rates making risk assets less attractive. How Bitcoin navigates the packed economic calendar and responds to the Fed’s next move will be critical. Should Bitcoin defy the macroeconomic pressures and capitalize on the "Uptober" effect, it could signal a newfound maturity and independent strength for the asset. Conversely, if macro factors prove dominant, it could temper expectations for immediate significant rallies and reinforce the notion that even cryptocurrencies are not immune to traditional economic forces. Investors will need to weigh these competing forces carefully, recognizing that while history offers guidance, the present economic landscape dictates the immediate future.