The cryptocurrency market is a dynamic and often volatile landscape, and investors constantly seek insights into the potential movements of digital assets. PI Network (PI), a project that has garnered significant attention for its mobile-first mining approach, is currently exhibiting a pattern of price consolidation that has captured the interest of traders and analysts. The PI token has entered a distinct flat channel, leading to questions about its ability to break free from this trading range and establish a new upward trajectory.
PI Network Enters a Consolidation Phase: Chart Analysis Reveals a Tight Trading Channel
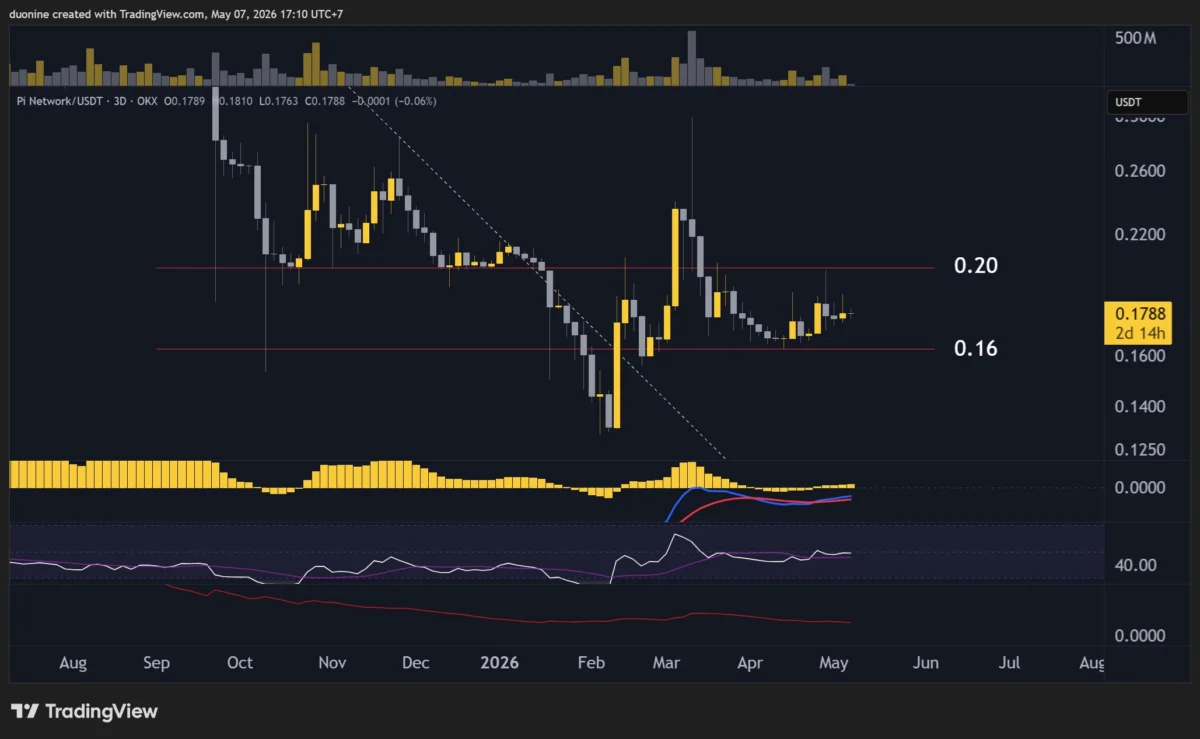
PI Network’s native token, PI, has been trading within a defined price range, often referred to as a "flat channel," since early March. This period of consolidation follows a bottoming out at approximately $0.13. The cryptocurrency is now oscillating between key support and resistance levels, specifically $0.16 for support and $0.20 for resistance. Attempts to breach these boundaries have so far been met with selling pressure, pushing the price back into the established range.
A notable instance of this occurred in late April when buyers attempted to break through the $0.20 resistance. However, this upward momentum was short-lived. The buying pressure was swiftly countered by a significant spike in selling volume on two separate occasions, effectively halting the advance and reintroducing PI to the lower end of its trading channel, near the $0.16 support level. This pattern suggests a stalemate between buyers and sellers, with neither side able to exert sustained control over the asset’s price.
Key Technical Levels to Watch
- Key Support Level: $0.16
- Key Resistance Levels: $0.20, $0.28
The $0.16 mark represents a crucial psychological and technical floor. A sustained breach below this level could signal a bearish turn, potentially leading to further price declines. Conversely, overcoming the $0.20 resistance is the immediate objective for bulls. A successful breakout above this level would be a significant development, potentially igniting further buying interest and paving the way for a test of the next significant resistance at $0.28.
Momentum Indicators Suggest Stagnation, But Hints of Potential Shift Emerge

The prevailing price action within the flat channel has coincided with a flattening of momentum across various technical indicators. Since March, the momentum has lacked a clear directional bias, mirroring the sideways trading pattern of PI’s price. This observation is consistent across multiple momentum indicators, which have been observed to fluctuate around their mid-range levels.
Despite the general lack of strong directional momentum, there are subtle indications that could foreshadow a potential breakout. Volume analysis reveals that while overall momentum has been flat, there were periods of increased trading activity in late April and throughout May. Although this increased volume was insufficient to propel PI definitively above the $0.20 resistance, it could signal growing interest from market participants.
Analysts suggest that another concerted attempt to breach the $0.20 resistance could potentially prove successful. If this psychological barrier is overcome, the next logical target for bullish traders would be the $0.28 resistance level. This would signify a material shift in market sentiment and a potential continuation of an upward trend.
The Daily RSI: A Barometer of Market Sentiment
The Relative Strength Index (RSI) on the daily chart provides further context for PI’s current market conditions. Over the past week, the daily RSI has been consistently hovering around the 50-point mark, which is considered the midpoint. This neutral positioning of the RSI underscores the lack of decisive momentum in either direction, reinforcing the notion that PI is in a period of price discovery and consolidation.
The current trading price of PI has been oscillating around the $0.18 level, a position that aligns with the neutral RSI. For PI to build a more robust bullish bias and set the stage for a potential breakout, the daily RSI would ideally need to ascend above the 50-point threshold and move towards the 70-point level. A sustained move into the upper reaches of the RSI typically signals strong buying pressure and the return of bullish conviction among traders.
Such a shift in RSI could coincide with renewed efforts to challenge the $0.20 resistance. A sustained break above this level, supported by a strengthening RSI, would be a significant indicator for traders looking to enter or increase their positions in PI Network.
Background and Context of PI Network
PI Network aims to create a cryptocurrency that can be mined by users through their mobile phones, a concept that has democratized access to cryptocurrency mining. Launched in 2019, PI Network’s core proposition revolves around building a widespread ecosystem and community around its digital currency. Unlike traditional cryptocurrencies that require significant computational power for mining (like Bitcoin), PI’s approach is designed to be accessible to a broader audience, fostering early adoption and network growth.
The project has maintained a focus on developing its ecosystem and preparing for a potential mainnet launch, which is a critical milestone for any blockchain project aiming for decentralization and wider adoption. The price action observed in the market, particularly the current consolidation phase, often occurs as projects mature and approach significant developmental stages or undergo rigorous testing and validation processes.
Timeline and Key Developments
- Early March: PI Network’s price bottoms out around $0.13, marking the beginning of the current consolidation phase.
- Since Early March: PI has consistently traded within a range defined by the $0.16 support and $0.20 resistance levels.
- Late April: An attempted breakout above the $0.20 resistance was met with increased selling pressure, pushing the price back down.
- May: Continued trading within the established channel, with fluctuating volume but no decisive directional move.
- Present: PI remains in a flat channel, with technical indicators suggesting a lack of strong momentum but potential for a future breakout.
The project’s development roadmap, including updates on its technology, community growth, and potential future listing on major exchanges, can significantly influence investor sentiment and, consequently, its price action. While the current analysis focuses on technical indicators, fundamental developments within the PI Network ecosystem will play a crucial role in determining its long-term price trajectory.
Broader Market Implications and Investor Sentiment
The consolidation phase observed in PI Network’s price is not uncommon in the cryptocurrency market, especially for projects that are in developmental stages or are awaiting significant catalysts. This period of sideways trading can be interpreted in several ways:
- Market Indecision: It reflects a period where market participants are weighing the project’s potential against current market conditions and its existing valuation.
- Accumulation Phase: For some investors, a consolidation period can present an opportunity to accumulate assets at a relatively stable price before a potential upward move.
- Testing of Support and Resistance: The repeated testing of support and resistance levels helps define the boundaries of the current market sentiment and can indicate the strength of conviction behind buyers and sellers.
The PI Network community, which is known for its active engagement, will be closely watching for any signs of a breakout. Positive developments within the project, such as successful technological upgrades, strategic partnerships, or a clear roadmap towards a full mainnet launch and potential exchange listings, could act as catalysts for renewed investor interest.
Potential Scenarios for PI Network’s Price Movement
Based on the current technical analysis, two primary scenarios are plausible for PI Network’s price movement:
-
Bullish Breakout: If PI manages to decisively break above the $0.20 resistance, supported by increasing volume and positive momentum indicators (like an RSI moving above 70), it could trigger a significant upward trend. The next target would then be the $0.28 resistance level. A sustained move above $0.28 would indicate a stronger bullish reversal.
-
Bearish Breakdown: Conversely, if PI fails to hold the $0.16 support level and experiences a significant downturn in volume and momentum, it could lead to a further price decline. In this scenario, investors would look to the $0.13 historical low as a potential point of stabilization, though a breach of this level could signal deeper corrections.
Conclusion: Awaiting a Catalyst for Directional Movement
PI Network’s price is currently in a state of equilibrium, characterized by a tight trading channel and neutral momentum indicators. The $0.16 support and $0.20 resistance levels are critical junctures that will dictate the short-term direction of the token. While the current market sentiment appears hesitant, the increased volume observed in recent weeks could be a precursor to a breakout.
Investors and traders will be closely monitoring PI Network’s development progress and market sentiment for any catalysts that could propel the price out of its current range. The ability of buyers to overcome the $0.20 resistance will be a key determinant in whether PI embarks on an upward trajectory or continues its sideways consolidation. The coming weeks will likely provide more clarity on which direction PI Network’s price will ultimately take.